Many of the social media sites have native analytics, but obviously, those stats don’t compare with dedicated measuring systems. If you are new to both, I’d recommend you start with StatCounter. I think that the interface of Google Analytics is unusual, and needs a little bit of time to get used to. It can be intimidating for novice users. So, having a background in an easier analytics system like StatCounter might help. That’s why I recommend StatCounter for total novices to digital analytics.
StatCounter
StatCounter has been around for ages. It was one of the most popular statistics services since before Google even existed. StatCounter advertises itself as capable of supporting more than 70 platforms. Including Tumblr, Blogger, WordPress, Squarespace, Smugmug, Google Sites, Weebly, Wix, Joomla, GoDaddy, Drupal, and Shopify, among others. StatCounter offers free installation guides for each one of them. The section of the site where the installation guides also has two additional sections to help everyone get started with it. I think that StatCounter is a way more beneficial starting point to web analytics for those that are new to the field. I don’t know about the paid plans, but the lack of customization of the free service is a kind of help, and a crutch for those that are new, if you will. It gives you a basic set of default analytics that, as I perceive them, are a tad more useful and easier to find and access than the default ones given by the default dashboards offered by Google Analytics.
Project Settings
You can go to this page by clicking on the gear icon in the Project page. This section has more than a dozen sub-sections. It includes even a section with a feature to sync your Google keyword data with it. Other than that, it teaches all kinds of cool tricks to do with the service.
The Good Things
All in all, StatCounter has around 40 main metrics. One can exponentially multiply this number by the use of filters. Four major heads:
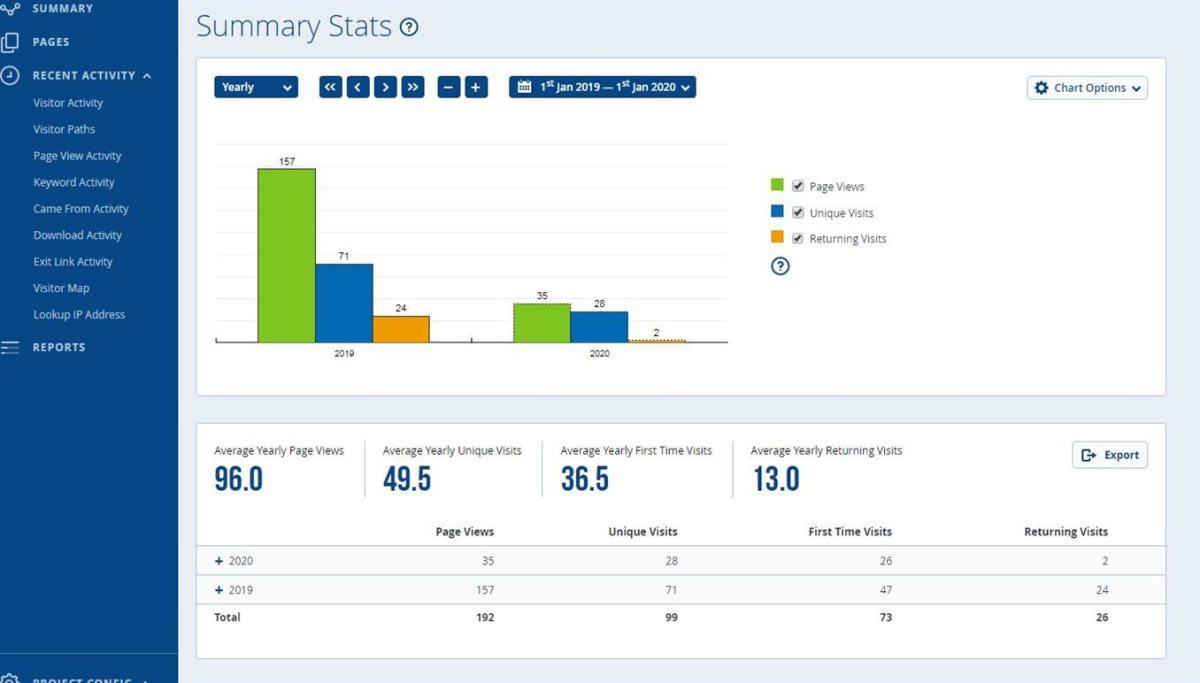
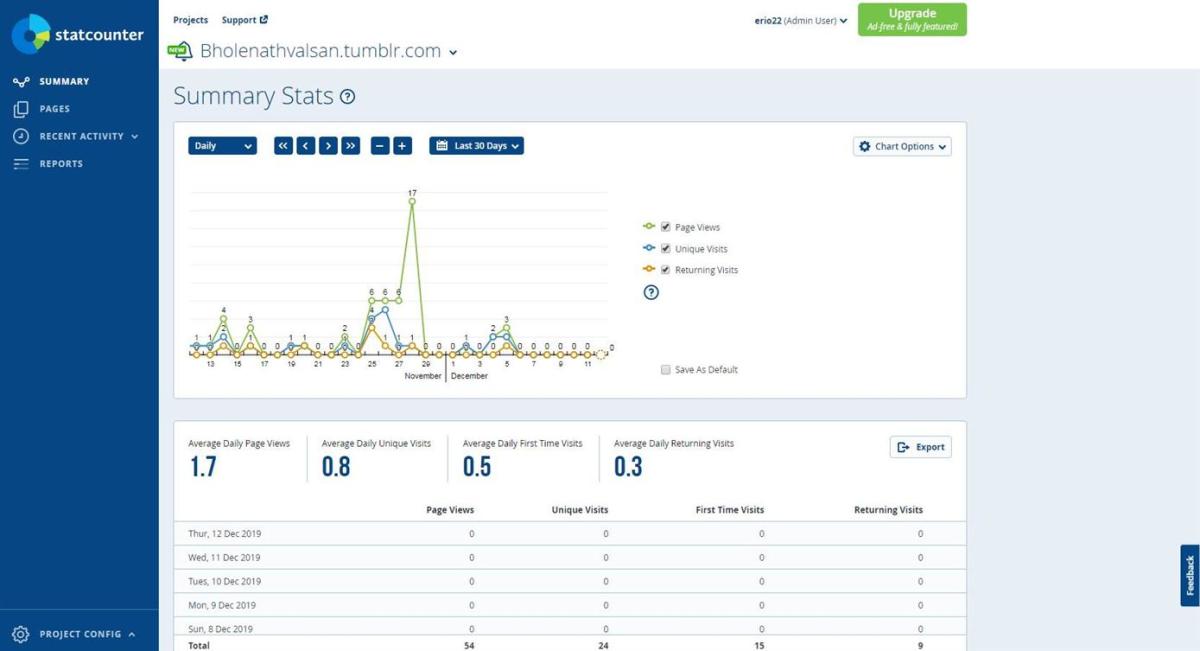
- Summary (2 Reports)
Timeline with line or bar charts, and very flexible time-span of the report configuration dialog. Chart detailing average daily visits and page views.
- Pages (23 filters)
This section has analyses of the individual pages of your website. Through it, you can measure several metrics. Around 20 different statistics about a website’s pages. Moreover, we can combine the filters for a total of 520+ different statics combinations to test the website pages. Still, when we go deeper into this report and click in the Page Analysis link we find out that for such deep analysis we must pay. The only metric in the Page Analysis given for free is Unique Visits. You have to upgrade to have these others in the same report: Search Traffic Website Referrals Social Traffic Paid Traffic
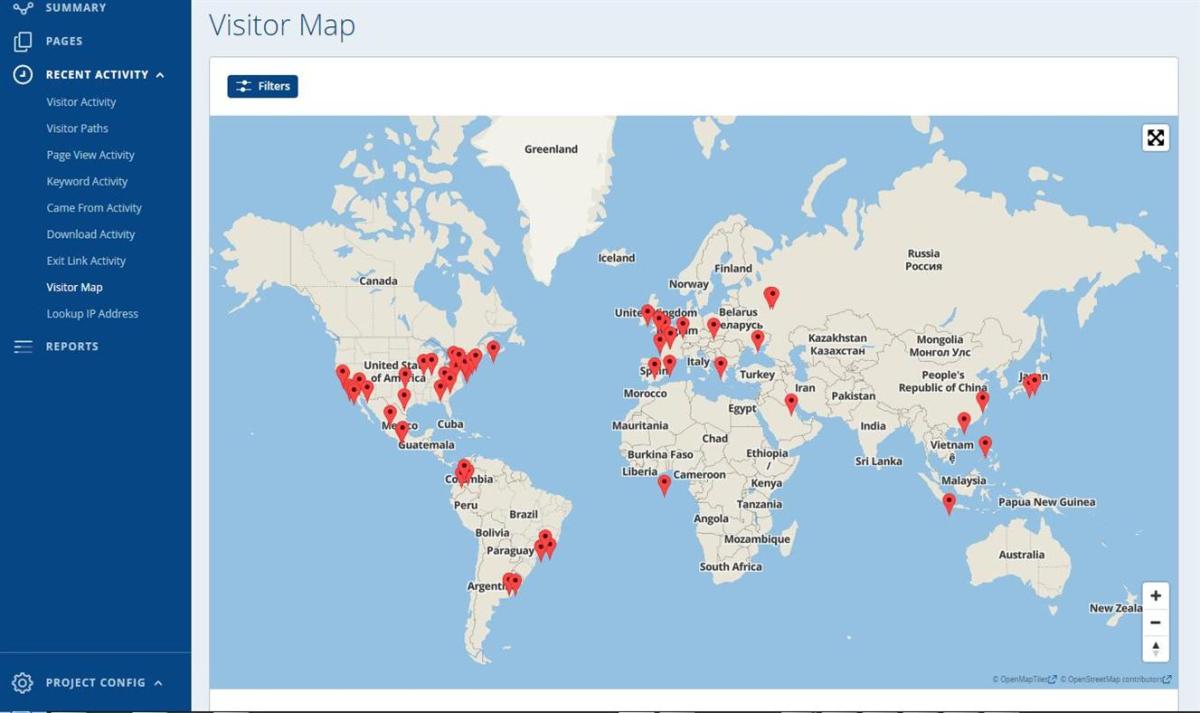
- Recent Activity Nine different reports:
Visitor Activity Visitor Paths Page View Activity Keyword Activity Came From Activity Download Activity Exit Link Activity Visitor Map Lookup IP Address
- Reports It’s a dashboard with seven widgets that shows at a glance these metrics:
Locations Traffic Pages Engagement Paid Traffic Exit Links System
It even has a widget to add custom tags.
Other of StatCounter’s Features
The custom tags feature of StatCounter may sound like a kludge to make StatCounter more granular like Google Analytics. I haven’t tried it, but I guess it has the potential to make the service as powerful and flexible as Google Analytics. StatCounter.com The idea is that with the help of a javascript one can associate tags to pages and streamline the data it collects into several of the web app’s reports. The help page about this feature even explains how to easily implement split A-B tests with it. If it works, that sounds like a killer feature. Another killer feature of StatCounter is its ability to easily create a filter. This has as many applications as the needs or imagination of the user. It is especially important if one does a lot of web administration and testing. If a filter is not in place, then one’s development and testing visits will warp the statistics; registering maintenance visits along with the user visits. There are ways to create a similar fix with Google Analytics, but I haven’t even tried to, because to do it with StatCounter is faster and easier. The only thing one has to do is creating a browser cookie, in the browser one uses to test and develop the website, in the settings section of the project. Another way of achieving easy filtering is Project Config > Ignore Visits. Both options, by IP address and by the webmaster’s ISP can work as filters too. By ISP, you should set your ISP picking one from StatCounter’s database of ISPs. Still, this approach has a considerable drawback. You’re going to lose the stats for all of your visitors that use the same ISP as you do. The other is by IP address, and this has the drawback of having to change it each time you change your IP address.
My Conclusion on StatCounter
Note that in the only part I wrote that you have to pay means that’s the only part you have to pay. Other than that, it’s free. Remember, they promise many advantages to upgrading. Like:
Traffic Trends Website Referrals Social Media and Paid Advertising stats
StatCounter offers ten different plans from 100k to 100m visits, with prices ranging from $89 to $4299 yearly fees.
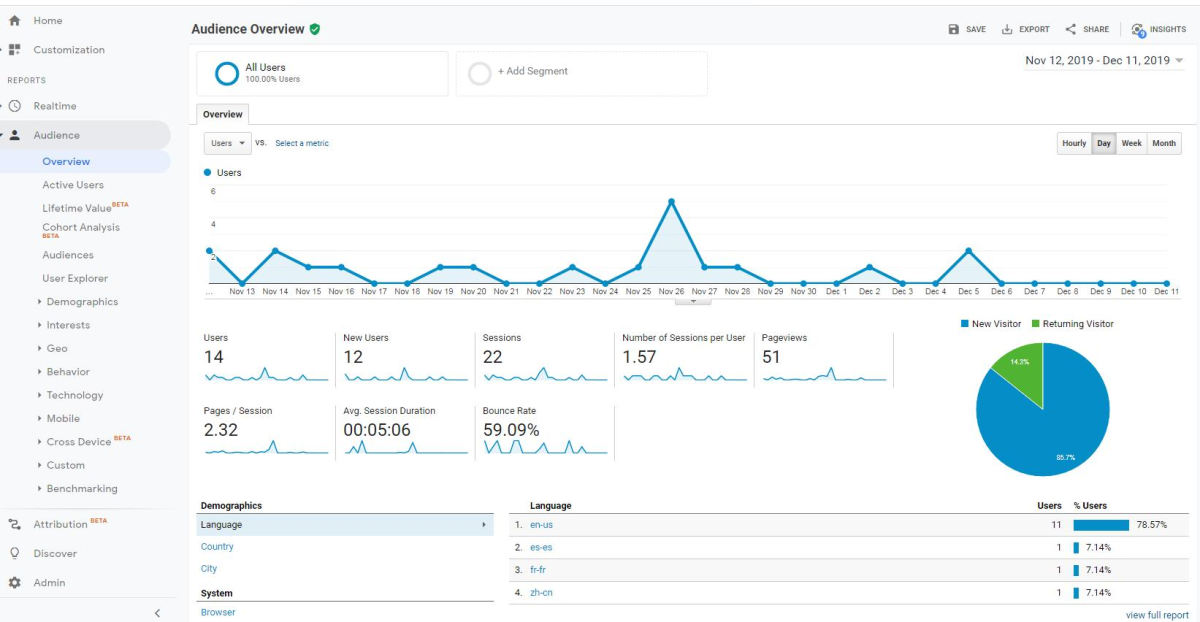
Google Analytics
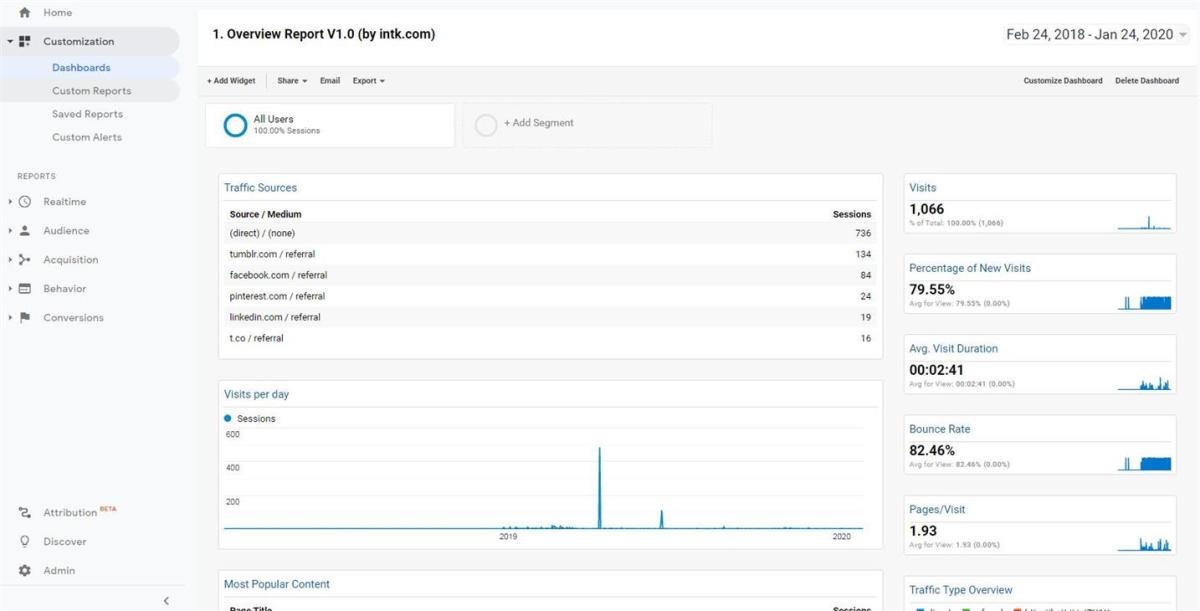
The free version of Google Analytics only requires a Google account. After connecting the service to one’s account and embedding the code in the property, as Google Analytics calls the connected sites and devices, Google Analytics beings logging stats. All fine and dandy about the basic Google Analytics, but if one doesn’t know where to begin customizing it, the reports feels just like dummy content. No excitement or sexiness there until we do our homework. To get the analytics one needs to meet one’s KPIs, with this free web app by Google, one needs to do considerable configuration work. Not constantly, but it requires both planning and configuring. The customization and configuration of this service should be done depending on the kind of property one wants to measure. It might be because, in my case of use, none of the default metrics on the pre-made dashboards of Google Analytics were useful for me, that I was forced to go deeper into it and create my own. Doing so is a real game-changer, and it’s where the web app shines. I didn’t need to do a course or even read a book to learn. A few articles by SEO experts did it for me. It’s not rocket science, and if you have the patience to go through the heaps of metrics to choose from, then this web app beats StatCounter, I dare say. When linking Google Analytics to a web property (website), you are given the choice to start from scratch or pick a dashboard template. What you see at the home screen of the web app are the widgets of the pre-designed template you picked. At the end of the day, all these are just examples, even if you think you’re so lucky as to be able to do with one of these. I don’t think that will work, for almost nobody. That’s why the way to use Google Analytics is to customize it.
Dashboards
In this section, we can create a 100% customized dashboard with all the reports on the metrics we care for. One only needs to add widgets and configure them. Some of the metrics require a dimension. Some of these may have additional dimensions that may be optional. One has to figure out an additional factor when adding a compulsory dimension. I think dimensions are just a fancy name for filter. To add a dimension, when adding a widget we must click in the “add a filter” option. I didn’t count the dimension options available, but a rough estimate is in the order of 150 dimensions we can choose. The use of dimensions is further narrowing statistics to a specified, customized metric we want. Custom Reports Can be of three types: Create custom reports by assigning metric groups and dimension drill-downs Saved Reports Create custom reports by assigning metric groups and dimension drill-downs. Custom Alerts Create alerts based on any of these conditions:
All Traffic Users Acquisition Behavior E-Commerce Systems
One can configure this to suit specific needs. For example, to create a way to automatize alerts to detect gaps in a website’s performance.
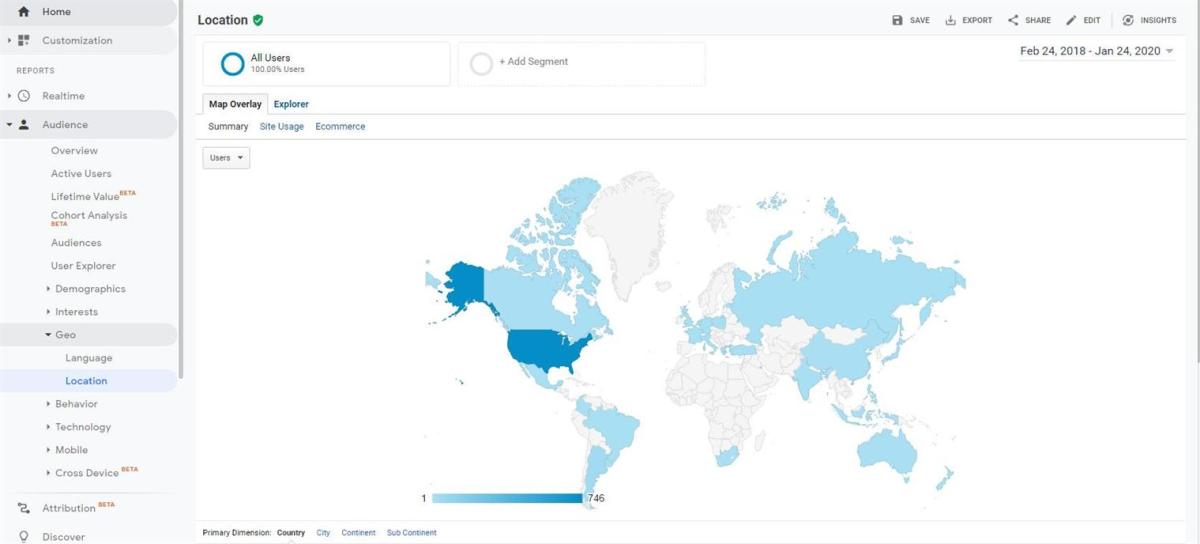
Reports Section
Around 91 metrics: Five major heads
Real-time 6 subcategories Audience 16 subcategories and 26 sub-subcategories Acquisition 6 subcategories and 24 sub-subcategories Behavior 8 subcategories and 19 sub-subcategories Conversions 3 subcategories and 16 sub-subcategories
When I said that the pre-packaged dashboards aren’t good I didn’t mean the reports that one can get navigating through this section. Of course that any report from the sub-heads can mean gold for a given person looking to measure a specific metric. But for those new, who don’t know what to look for, it can be time-consuming just going one by one and figuring the metrics out.
My Conclusion on Google Analytics
Google Analytics is a very robust platform that probably can support all your digital analytics needs. It has a tiered paid version, Google Analytics 360 for more than ten million hits per month. Additionally, GA360 offers more features, like more custom dimensions, number of views, advanced funnel reporting and guaranteed 4-hour data freshness. It starts at $150,000 a year, $12,500 invoiced monthly.
Who Wins, Then? G.A. or StatCounter?
Like I demonstrated both are very deep and at the same time different. Beginners and small and medium business could benefit from StatCounter’s easier to navigate interface. More advanced users might find Google Analytics far more flexible and customizable, if more complex.