For example, if you have a business in three different countries, you can easily create a Bing Map in Excel to plot a marker for each location where the sizes of the markers will display in different sizes. The varying sizes can be based on the revenue or some other numeric figure to show how each location varies from the other. Next, we’ll look at the steps used to insert a Bing Map into an Excel spreadsheet.
Insert the Bing Map
To insert a Bing Map, click on the insert tab, then click on the Bing Maps add-in button from the add-ins section of the ribbon. The button is hard to miss because it looks like the Bing logo.
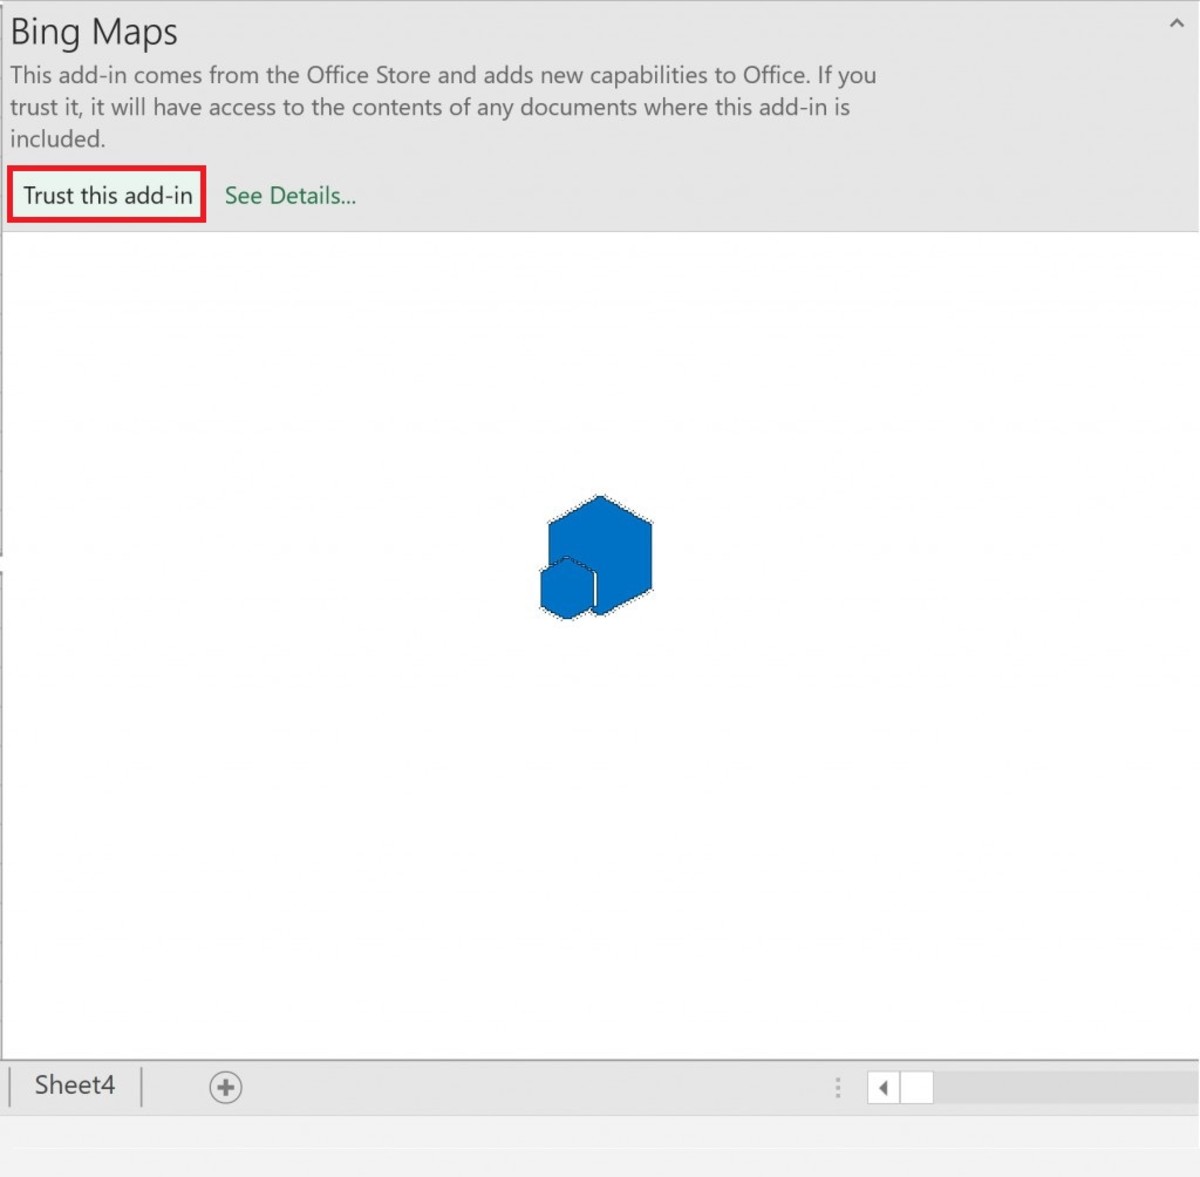
Activate the Map by Trusting the Add-in
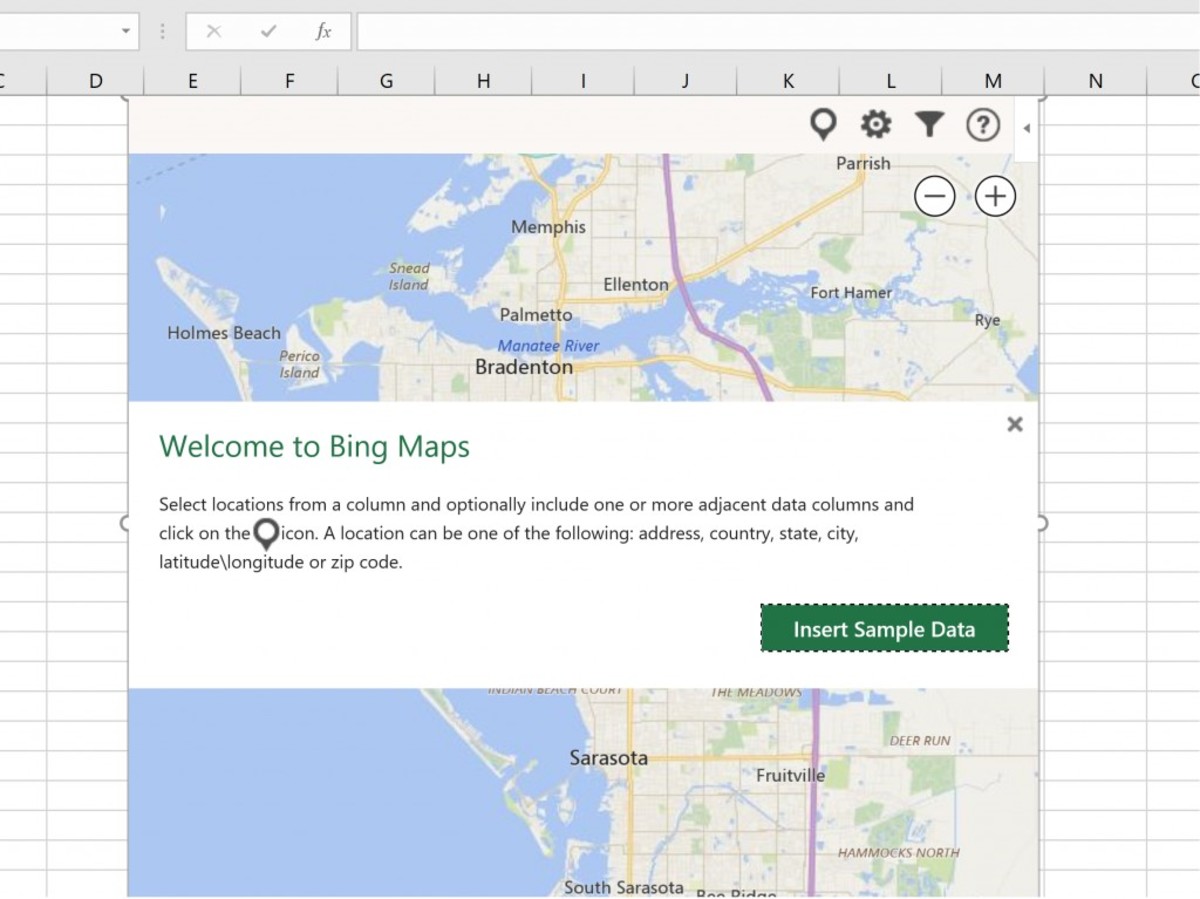
Click on the button that says “Trust this add-in” to get the Bing map to appear. Below is what you should see after you trust the add-in. To make the add-in useful, data needs to be added to the map. Otherwise, the map will hot have any location markers or functionality.
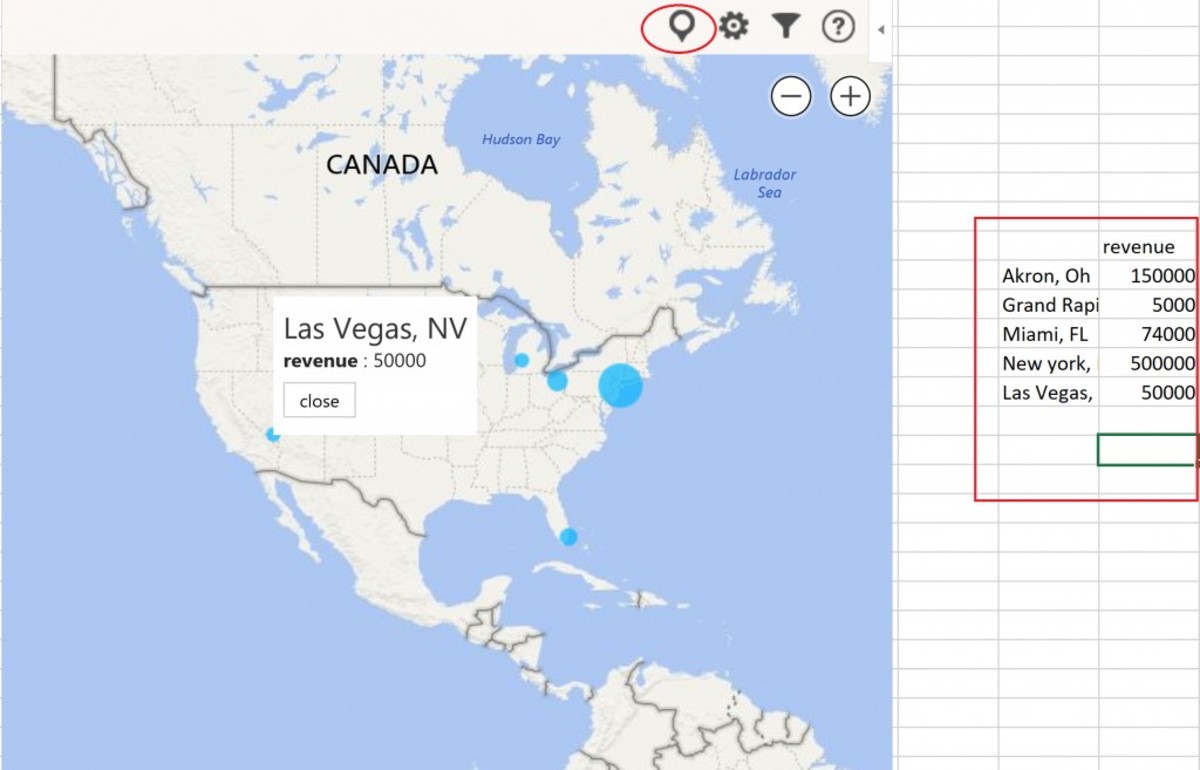
Adding Location Data to the Map
Generally, you have two main options for displaying your data on your Bing Map. You may want to just show categorical data. In this case, the locations would be the only data to display on the map with a marker. In another instance, you can have categorical and numeric data. For example, showing company locations and the revenue for each location would represent this scenario. Once you add locations to a column in Excel and numeric data related to that those locations in a column to the right, you can select that range of data and click the location icon on the Bing Map. This will save the data to the Bing Map. Below is an illustration of how to set up your columns and where to find the location icon. If you only want to show the categorical information, you would only select the location column.
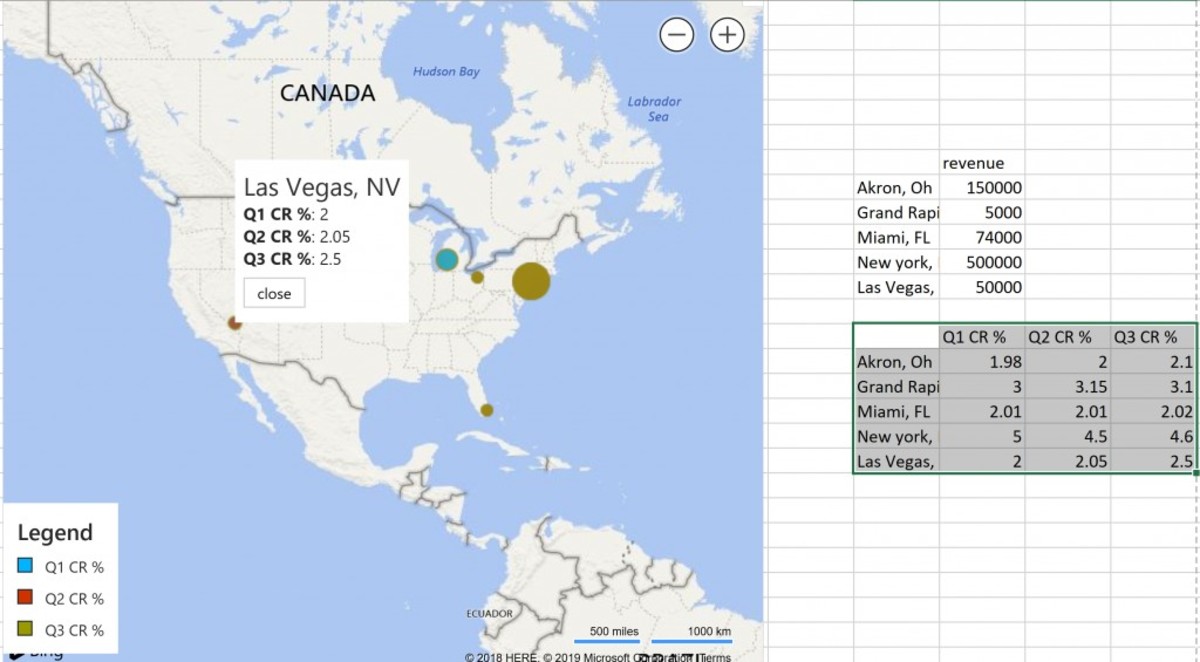
Adding Multiple Numeric Data
You can add more than one piece of numeric data. Adding multiple columns of numeric data to your table can allow your Bing Maps user to look at the data with more dimensions.
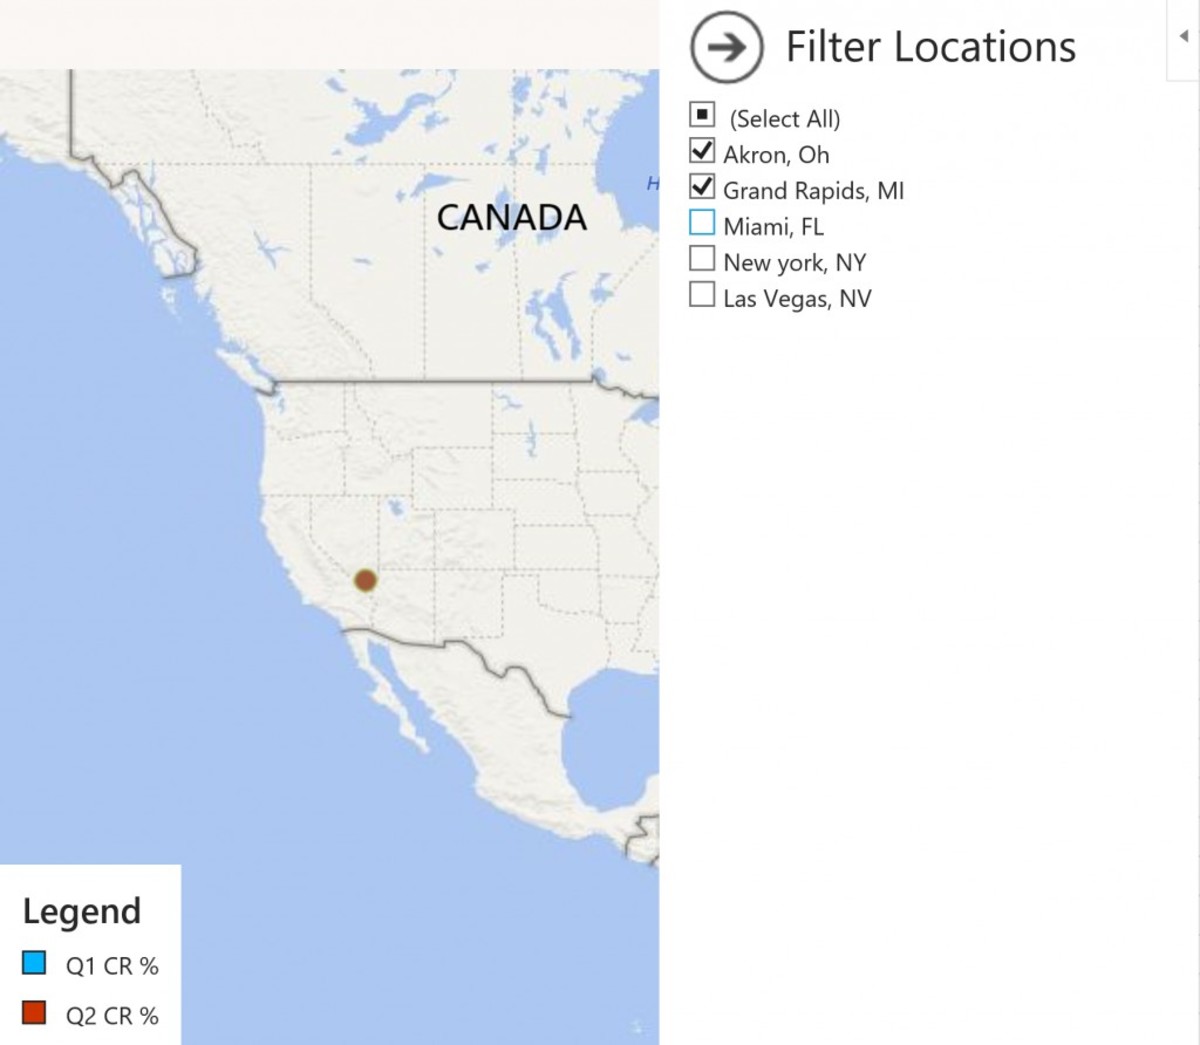
Creating Location Filters
There is a feature that allows you to filter specific views by limiting the number of locations that will be plotted on the map. This feature can be opened by clicking on the filter icon on the map toolbar.
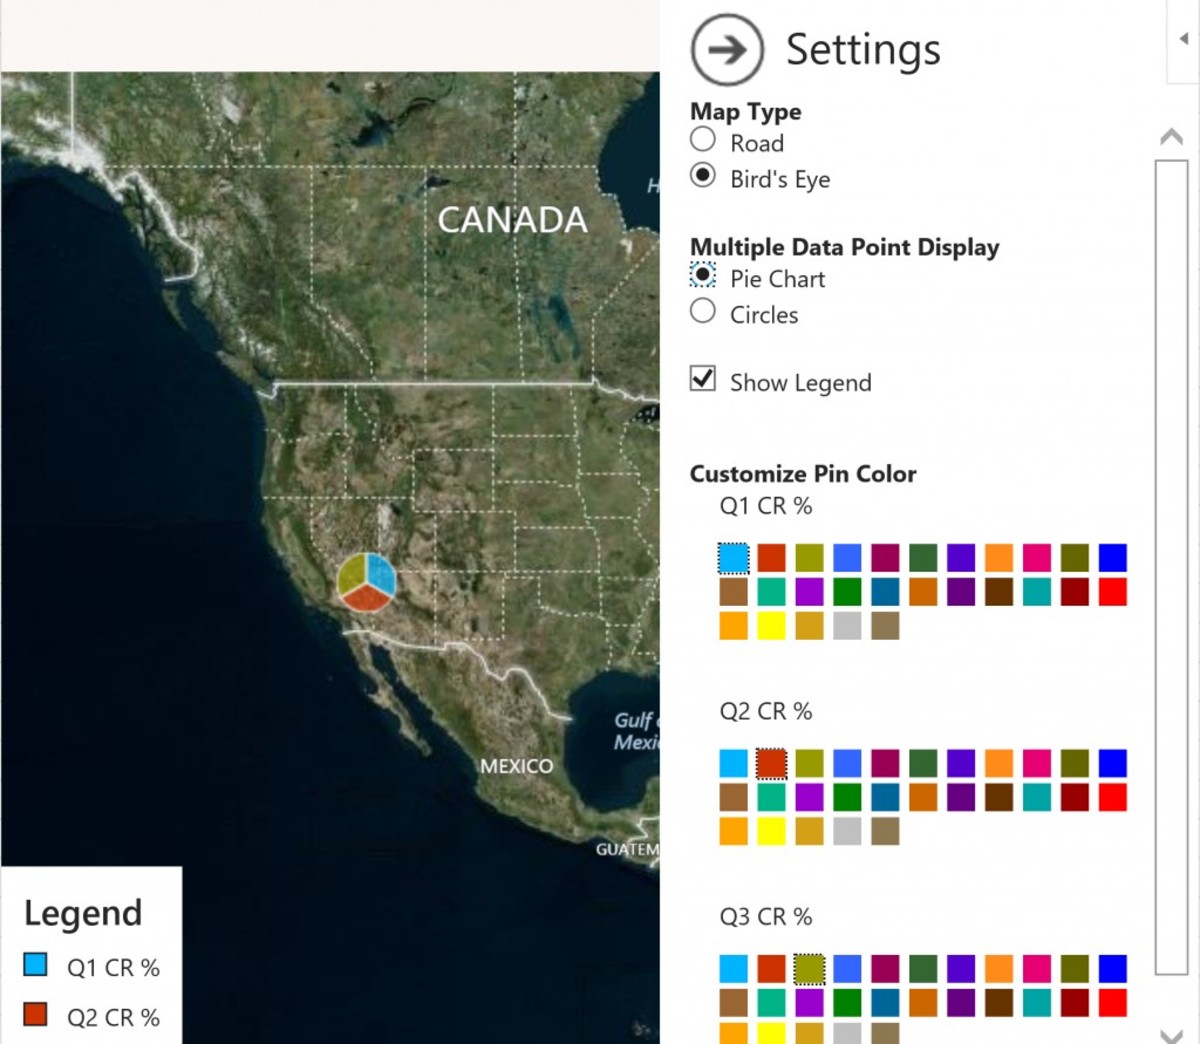
Bing Map Settings
Use the Bing Maps settings to create a map look that is best for your audience. The settings that can be changed include:
Map type Data Point Display type Optional Legend Color of markers
Increase Map Size and Zoom
Lastly, you can change the map size by dragging the corners of the map inward or outward. The magnification of the map can also be changed with the use of zoom buttons. This content is accurate and true to the best of the author’s knowledge and is not meant to substitute for formal and individualized advice from a qualified professional. © 2020 Joshua Crowder