For whatever reason, it’s a viable way to scale some plotting. However, there are some catches and caveats in order for it to go smoothly. I’ll cover what you need to pay attention to on the page below so you can hopefully bypass many of the mistakes I’ve made. I’ll also cover the performance difference of choosing to go the USB route versus internal drives by sharing all my testing results. Additionally, I’ll include links to the exact products I used if you wish to purchase them yourself.
Knowing Your USB Ports
This is the most important aspect of plotting via USB because the bandwidth capabilities of your port will most likely be your major bottleneck. In short, you want the fastest USB ports to scale the most parallel plotting.
USB 2.0 Ports
These are most often black and are incredibly slow with a speed of only 480Mbps. Ultimately, without USB 3.0 or higher ports, USB plotting is non-viable.
USB 3.0 Ports
These are blue-colored and have a rated speed of 5 Gbps. They are sometimes referred to as “SuperSpeed” and may have an SS label next to the port. They are the minimum to plot via USB and can likely support 2-3 parallel plots.
USB 3.1 Ports
This is where things get a little more complicated. USB 3.1 may be teal-colored ports and should feature a speed of 10Gbps. However, through the life of USB 3.0, some changes in terminology and usage have changed. As a result, you may find blue-colored ports that actually feature 10Gbps speeds or uncolored USB-C ports (the rounder ones with a smaller dual side connector) that also feature 10Gbps. The best indicator your USB ports feature 10Gbps speeds is an SS label with a 10 next to it. When in doubt, you may have to refer to your hardware manual.
USB 3.2 Ports
Let’s make it more confusing! USB 3.2 ports are red, but also often feature 10Gbps speeds, but might feature 20Gbps speeds. The best indicator of you having a port capable of 20Gbps is again the SS label with a 20 next to it. The changes in terminology I referenced above make this challenging. Currently, USB 3.0+ ports have mostly been renamed to USB 3.2 gen 1, gen 2, and gen 2x2:
USB 3.0 became USB 3.2 gen 1 (Speed of 5Gbps) USB 3.1 became USB 3.2 gen 2 (Speed of 10Gbps) USB 3.2 became USB 3.2 gen 2x2 (Speed of 20Gbps)
It’s also important to note that most consumer computers will have all their USB ports on one controller. Meaning that you may have 4 USB 3.0 ports, but they share the same bandwidth. This means if you were to use 4 USB enclosures, they would all share the same 5Gbps, thus bottlenecking each other. I realize that altogether this is a nightmare to follow, but the port speeds set a bottleneck for plotting and are important to understand. Very roughly, the ports create the following bottlenecks:
5Gbps allows for roughly 2-3 parallel plots via a 1TB M.2 NVMe drive 10Gbps allows for roughly 5-7 parallel plots via a 2TB M.2 NVMe drive 20Gbps should allow for much more, but I will be unable to test it myself so I won’t state a number
That’s the theory, but it’s important to test the practicality of it to confirm how realistic this is.
Testing Parallel Plotting
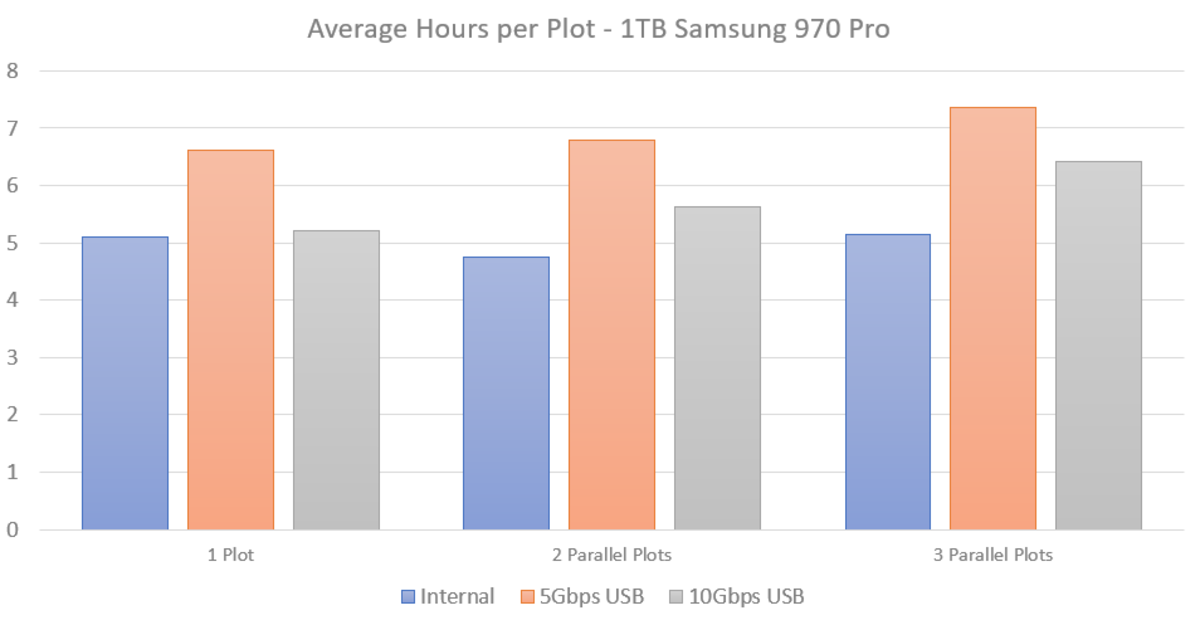
In order to really figure out how effective USB enclosure plotting is, I designed a test to explore the difference in speeds of parallel plotting. I tracked parallel plotting speeds of 1, 2, and 3 plots using a 1TB Samsung 970 Pro internally, externally with a 5Gbps USB port, and externally with a 10 Gbps USB port. To push the high end, I also compared the difference between 6 and 7 parallel plots on a Sabrent Rocket 4 internally against externally in a 10Gbps USB port. The goal was to identify what bottlenecks were hit and to what extent the USB port was a limiter in plotting.
The USB Enclosure I Tested With:
1TB Plotting Time Comparison—Part 1
Results—1TB
Using a 1TB Samsung 970 Pro for the first test, overall I was fairly pleased. Plotting 3 parallel plots via USB was about 30% slower with a regular 5Gbps (A standard USB 3.0 port) and about 20% slower with a 10Gbps port. With this data, I’d consider USB plotting viable, though with a clear downside. However, I used very high settings of 6750 RAM and 6 threads to push the plotting speed and was curious what the plotting time difference would be in default settings.
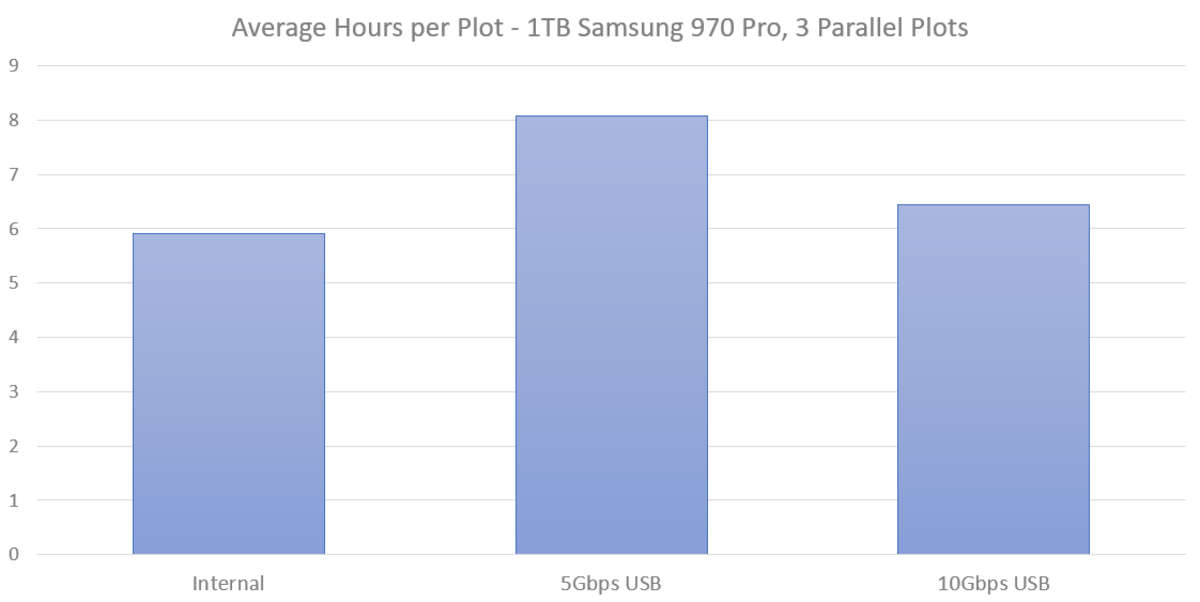
1TB Plotting Time Comparison—Part 2
USB Plotting Conclusion—1TB
In the second round of testing, the results were close but a little odder. The gap in performance between internal and a 5Gbps USB port grew from 30% to 35%, a 2-hour difference. However, plotting on a 10Gbps USB port shrunk to a 10% performance gap. This creates a total range of USB plotting 3 parallel plots between 10% and 35%. The higher end of this being acceptable but a somewhat heavy price to pay, while the lower end being unexpectedly good.
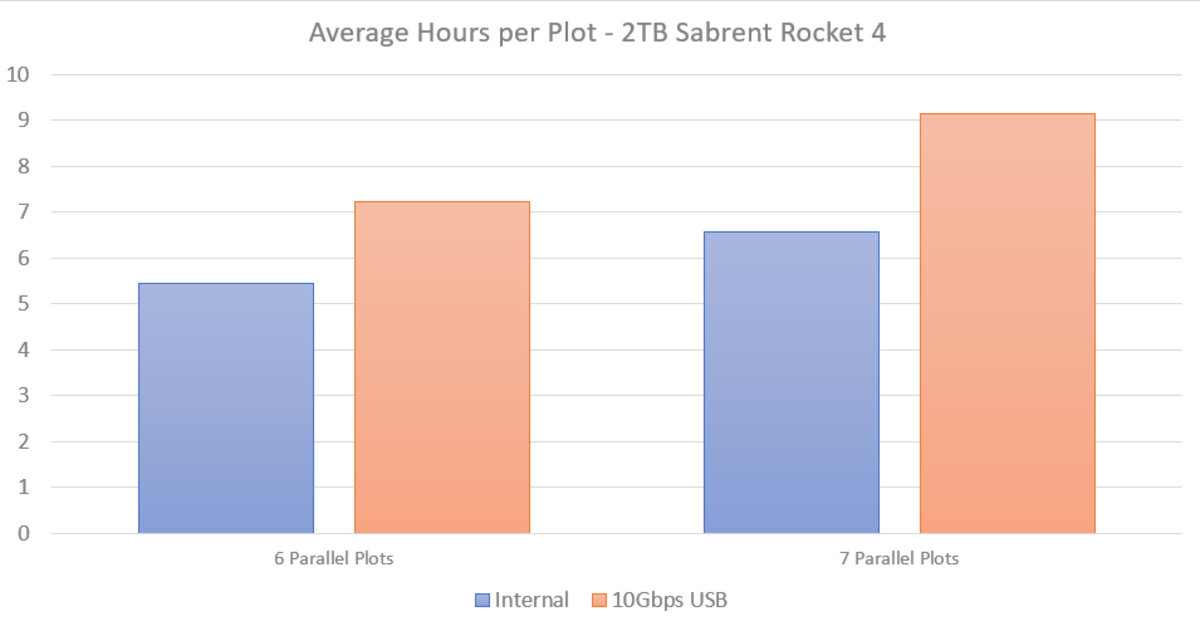
2TB Plotting Time Comparison
Results and Conclusions
While I knew a 5Gbps could not handle enough parallel plots to justify a 2TB drive in a USB enclosure, I was curious if 10Gbps could. To my surprise, it actually could decently well! With fairly aggressive settings on 7 parallel plots, my initial result was a 30% slowdown. This is definitely on the high end, though still viable. However, I suspected I was over-taxing the device, and decided to loosen the settings to 6 parallel plots with a more reasonable delay. This led to a small improvement in total plots per day bringing the USB plotting from 18 to 20 plots per day. Furthermore, it lowered the gap to about a 25% slowdown, plotting 20 plots per day versus the same settings internally delivering 26 plots. Again, falling in this 20-30% range, something decently viable.
The 1TB M.2 NVMe SSD I Tested With:
The 2TB M.2 NVMe SSD I Tested With:
Troubleshooting
Beyond the speed of plotting via USB, there are more things you need to be aware of if you intend to do it. Using external USB enclosures have a few more possible things that could go wrong you’ll need to be prepared for. I’ve listed a few of the top issues you may run into. Though frankly, of any issue you’re likely to run into while plotting with USB externals it’s likely to be more related to #1 and #2 above, particularly due to the tricky nature of finding and identifying the right hardware that supports high USB versions.
Final Thoughts
Overall plotting via USB enclosures is both viable and surprisingly cost-effective. Representing a slowdown of 10% to 35%, this makes it a good way to take advantage of old hardware or dabble in plotting without committing to a dedicated plotting machine. Furthermore, with some tweaking and optimal settings, the gap you experience could be closer to the lower end. I would highly recommend in any circumstance to use a plot manager such as Swar, but it’s particularly helpful in situations like this with more sensitive bottlenecks. This all certainly comes with some added complexity and challenges, but not disproportionately so. I personally use a mix of dedicated budget plotters and USB enclosures attached to older machines I have laying around. This article is accurate and true to the best of the author’s knowledge. Content is for informational or entertainment purposes only and does not substitute for personal counsel or professional advice in business, financial, legal, or technical matters.