Graphing HubPages Earnings Data in a PivotTable
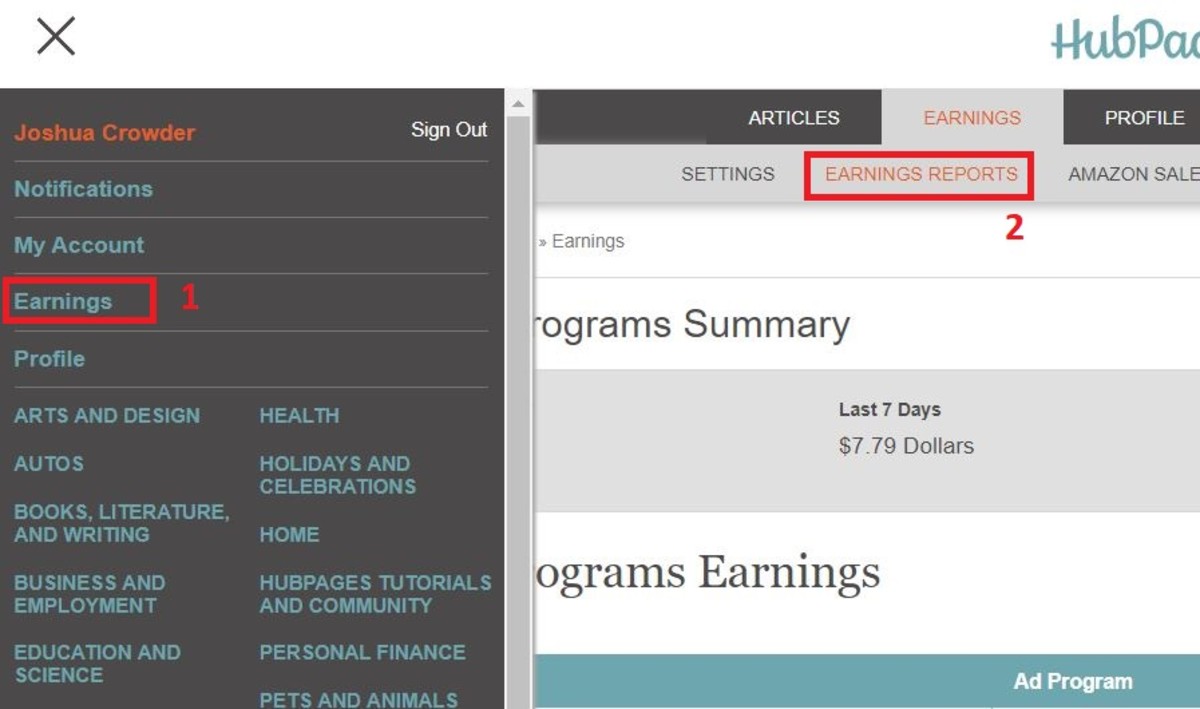
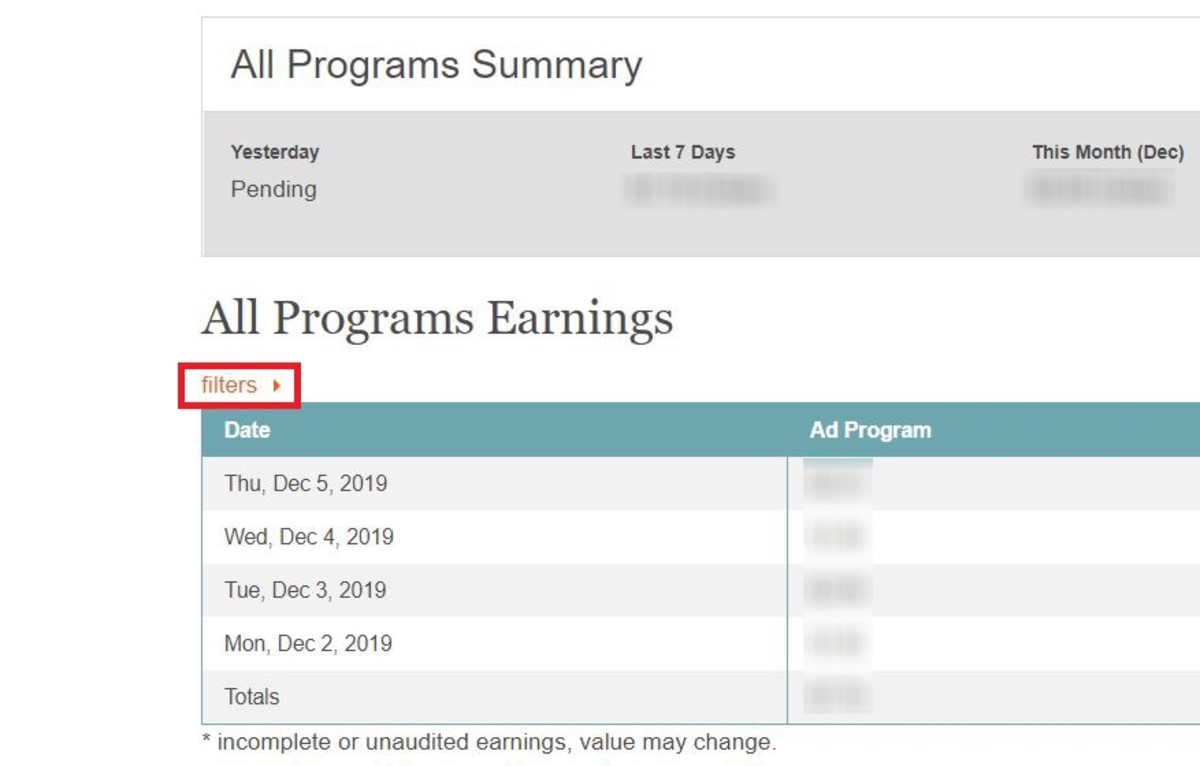
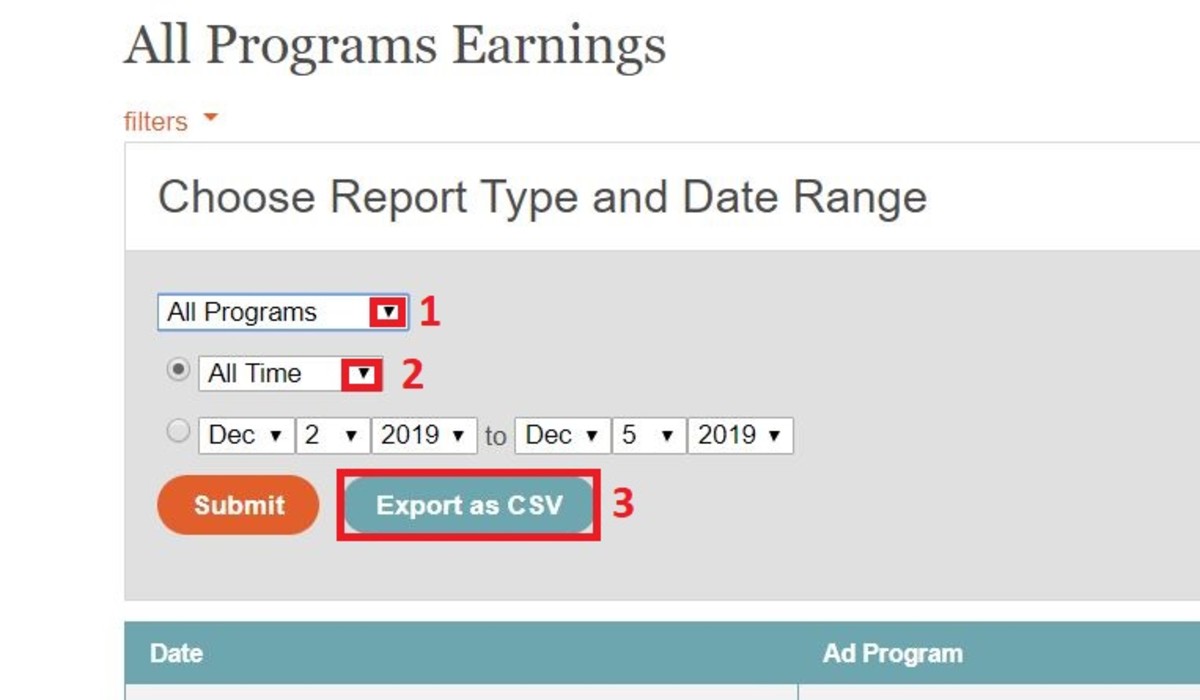
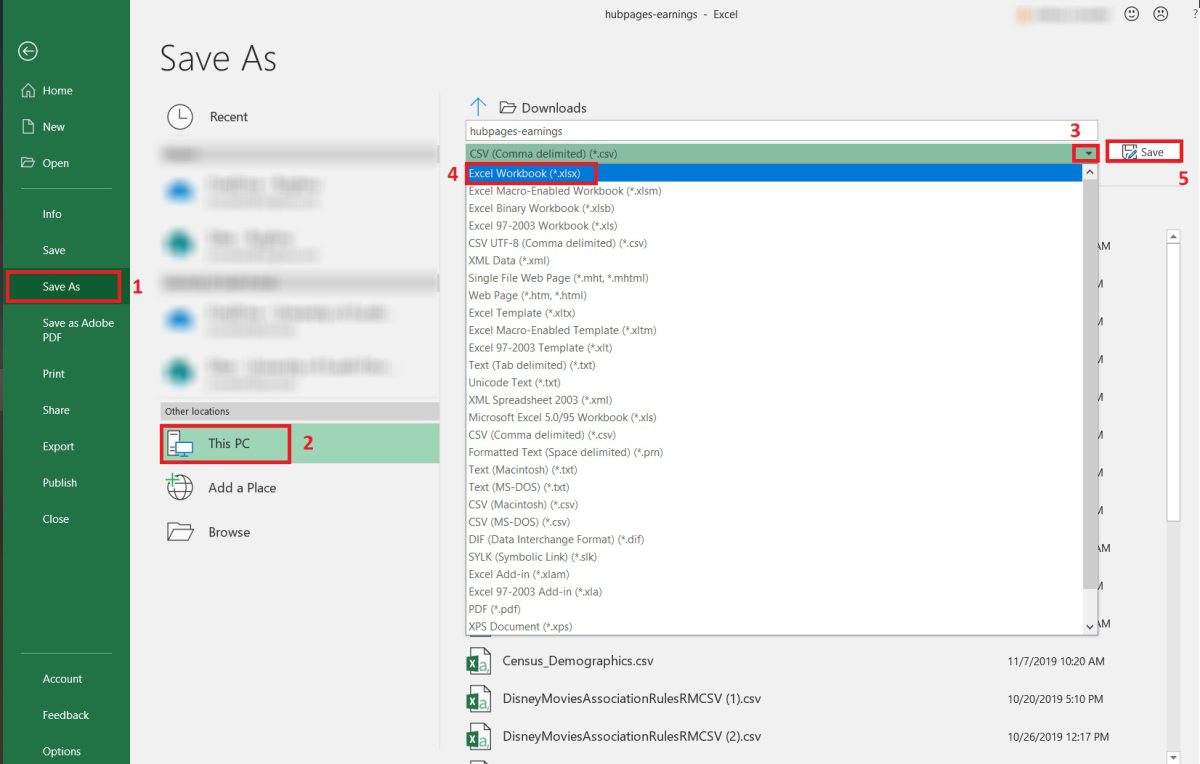
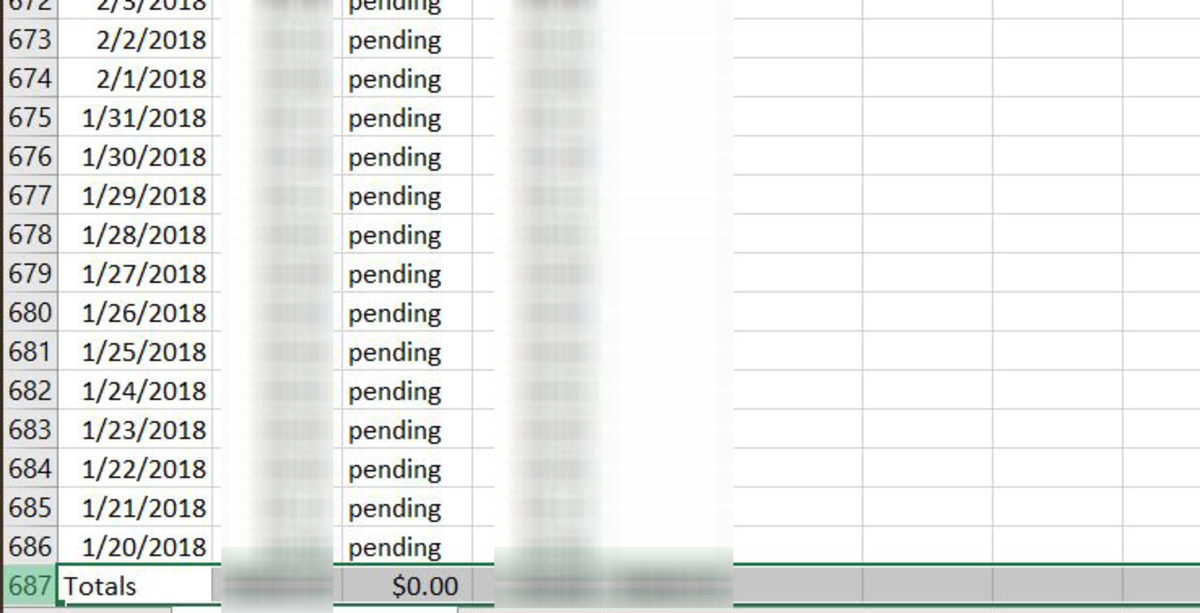
A Pivot Table is great for looking at data in different dimensions. Pivot Tables are usually more worth wild when there are lots of attributes involved, but it’s a nice quick way to turn HubPages earning data into a table with a corresponding bar graph. The first step to creating this Pivot Table for HubPages data is to gather the needed data. The earnings data can be found by clicking earnings in the sidebar on the HubPages site or by clicking the earnings reports tab under the earnings section. Either method will take you to the correct page. In this next screen, you will need to find the word filter on the page. Click this filter option so you can receive access to a downloadable earnings report. Next, click the first drop-down shown below and choose all programs. Click in the next drop-down below and select all time. These two settings will allow us to receive all data relevant to daily sales amounts. Click the export as .csv button to download the report. Immediately after the report is downloaded, it needs to be saved as an Excel workbook because the .csv file format has some reporting limitations. To save the file go to save as, choose a place on your computer to save it, save it as an Excel workbook, and click the OK button. Each step can be found in the illustration below. When you open the file, click on one of the cells and press Ctrl + End. This will take you to the last row. To clean the data, delete the last total row. Next, select the last row of data and press Ctrl + Shift + ↑. This will select all your data.
Clean the Data
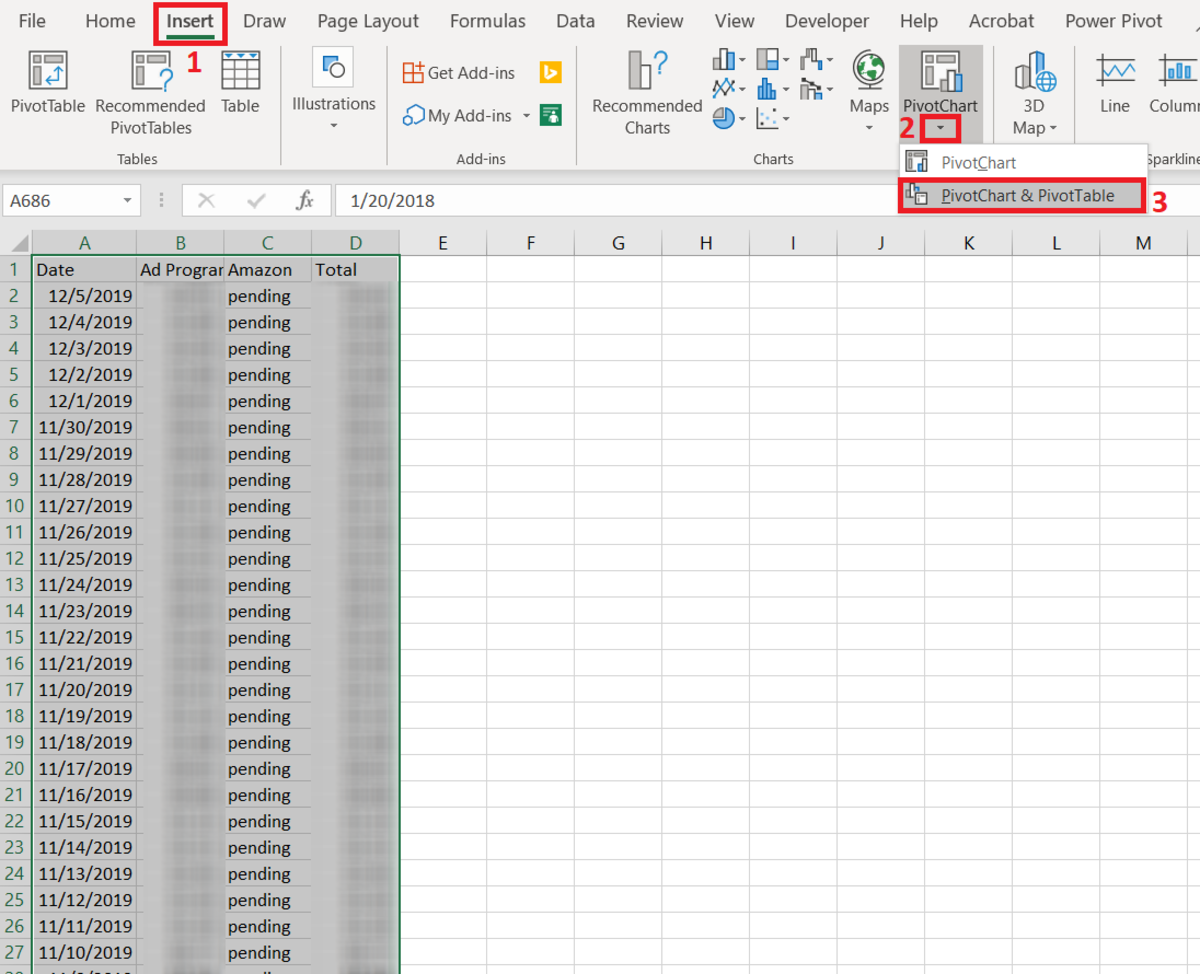
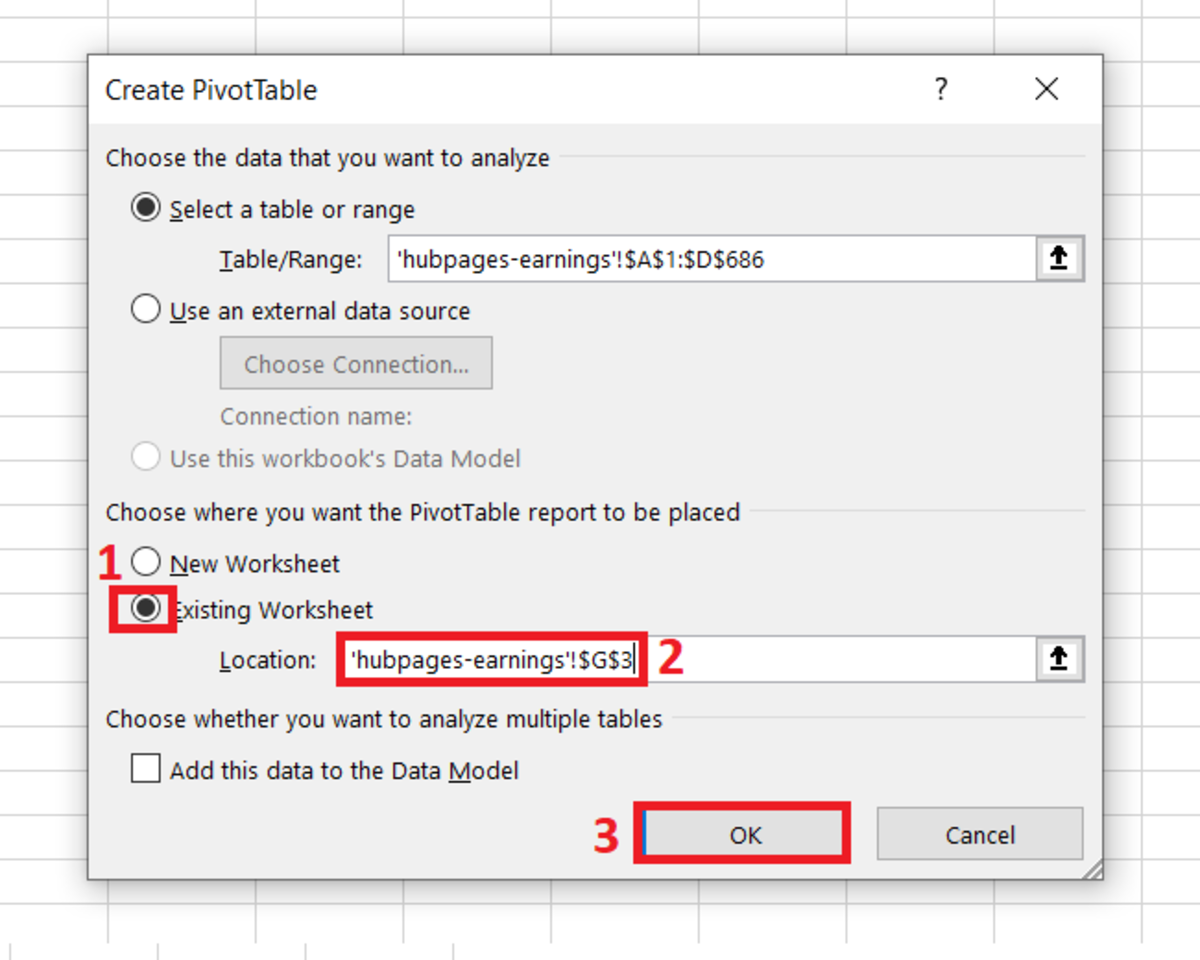
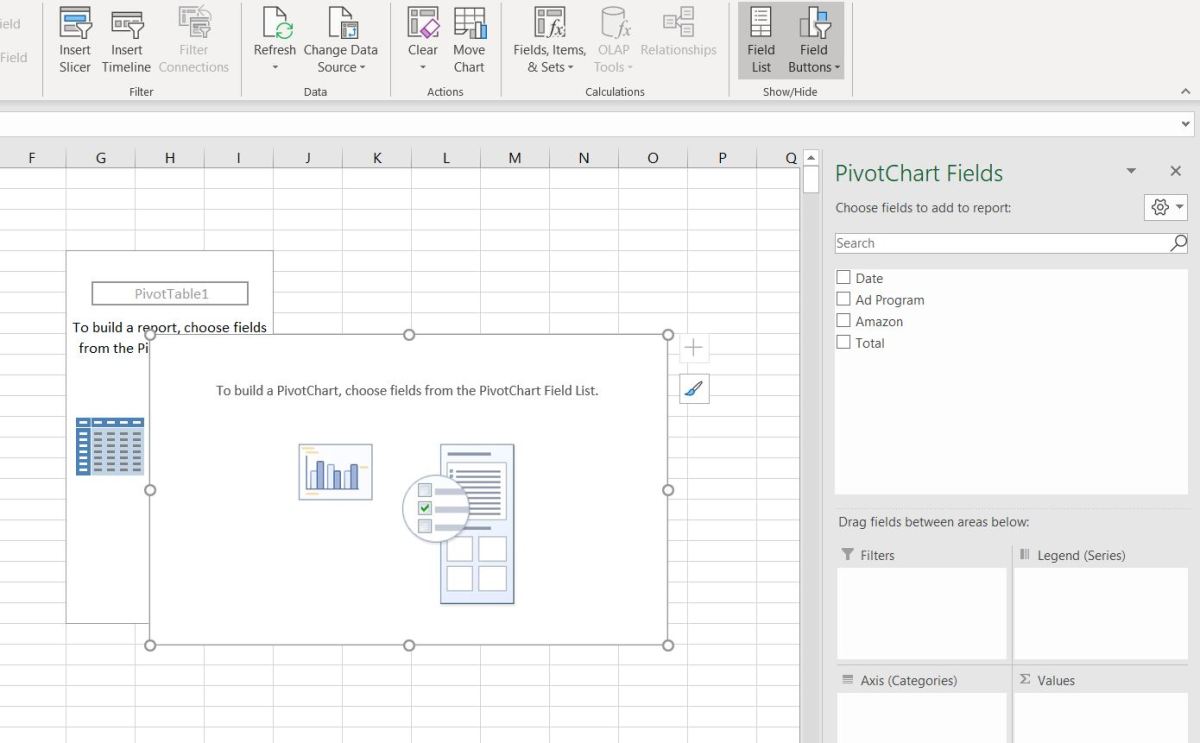
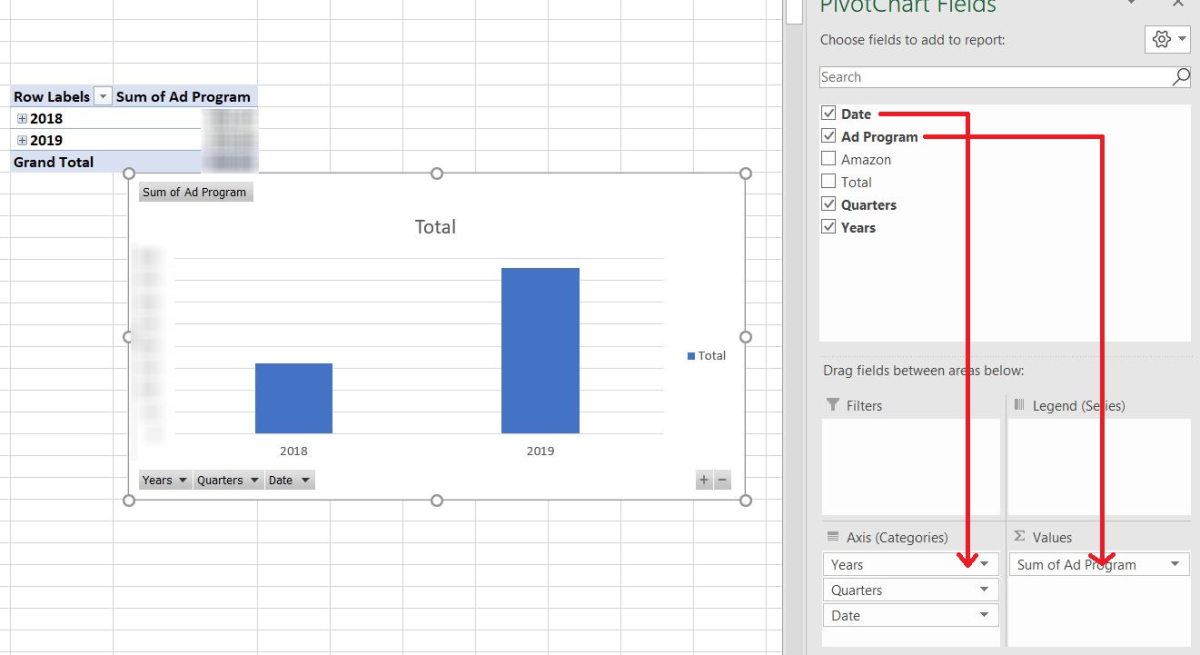
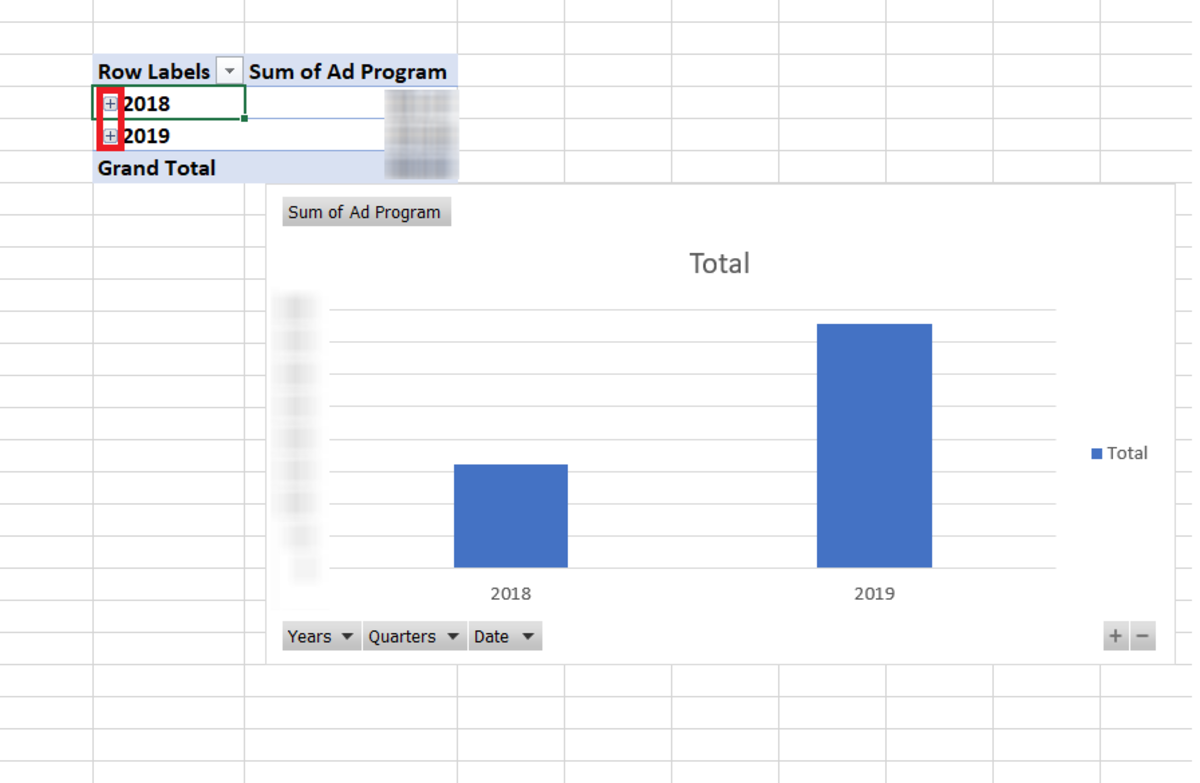
At this point, all the data should be highlighted. Select the Insert tab and click on the Pivot Table button that is in the chart section. You will have two options. Choose the option Pivot Chart & Pivot Table. A create Pivot Table window will appear. Click on the bubble for the existing worksheet and then click in a cell where you want the Pivot Table to appear. The location of the cell chosen will show up in the box below that is labeled with the number 2. Finally, click OK to generate a Pivot Table and graph. A blank Pivot Table chart and field list will appear. If the field list does not appear, go ahead and click on the button labeled field list. With the left button on the mouse held down, drag the date word from the top of the Pivot Tables field area to the categories box. Additionally, drag the ad program down to the values box. I’d like to break these years into quarters to have a better understanding of how my earnings have increased incrementally. By clicking on the boxes with the plus signs on the left side of the Pivot Table, the Pivot Table and graph will drill down into quarters.
Analysis
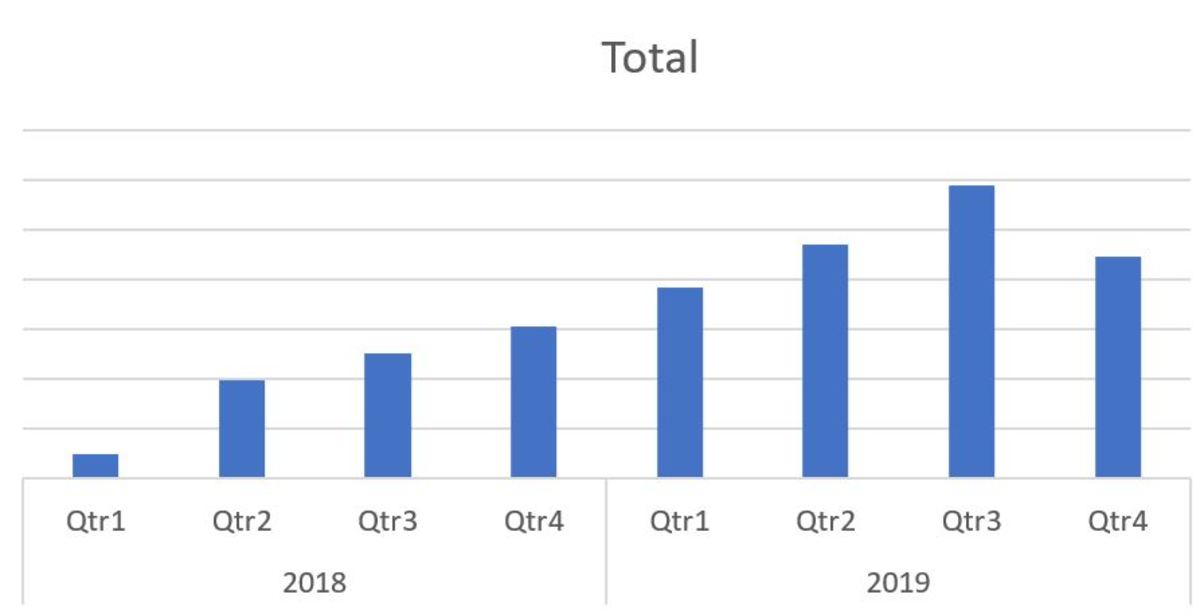
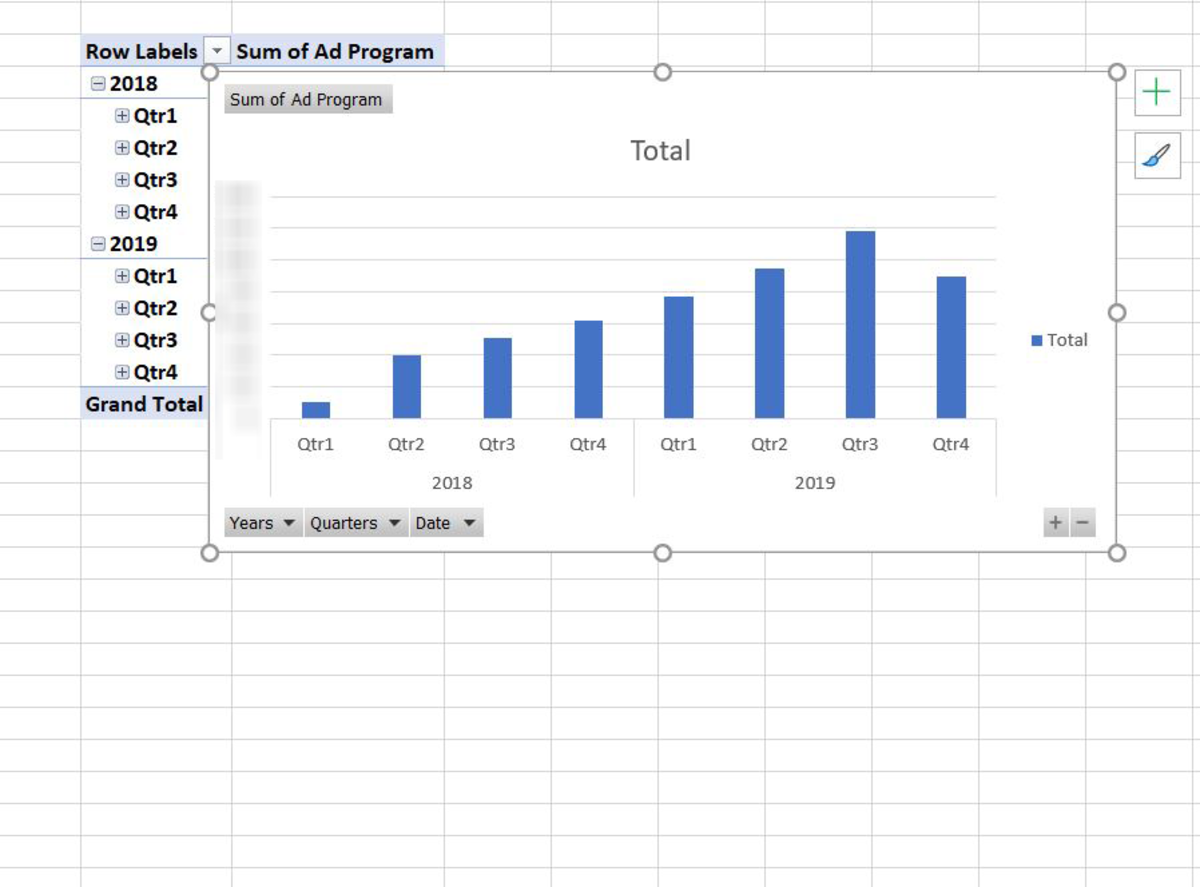
It is hard to properly analyze the graph without the totals for each bar. Unfortunately, the numeric data needs to be blurred. I made earnings in each quarter since I started writing articles. This can be seen by the incline in bar heights for each quarter. Each quarter’s earnings grew except for the 4th quarter of 2019 because I still had a month’s worth of earnings to collect before the new year. The low 2019 4th quarter may also be attributed to the fact that my article views are normally the lowest at this time of year.
Other Scenarios
This content is accurate and true to the best of the author’s knowledge and is not meant to substitute for formal and individualized advice from a qualified professional. © 2019 Joshua Crowder
Comments
Joshua Crowder (author) from Tampa, FL on December 15, 2019: Thanks! I think everyone should see how they have improved or set a benchmark for improvement. Sanjay Sharma from Mandi (HP) India on December 14, 2019: Nice idea. Thanks for sharing the information.