The YHK Store Sample Data is made possible using free online text and number generator tools.
Copy This Google Sheet Data File To Your Google Account
Make a copy of this YHK Store Sample Data and store it under the same Google Account which you will be using for Google Data Sheet later.
What’s In The Data?
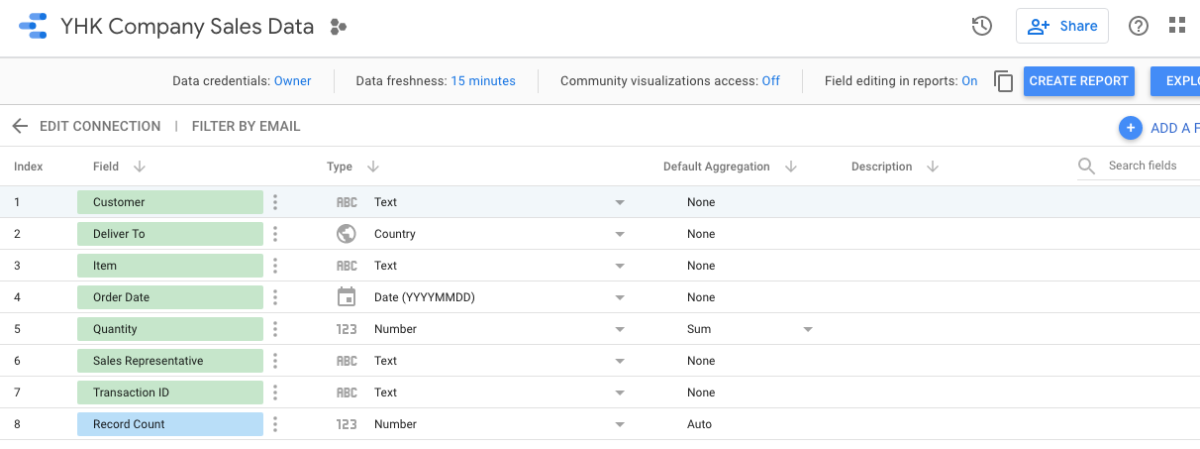
Transaction ID – Sale Transaction Number generated by the Company. There are total 3000 transactions in the data. Order Date – Date the order was made by the customer. Customer – Customer’s name on the order. Deliver To – State the Country of Delivery. Sales Representative – Sales representatives working at YHK Store. Item – Item the customer ordered. Quantity – Quantity of the item ordered.
How to Connect to Google Sheets?
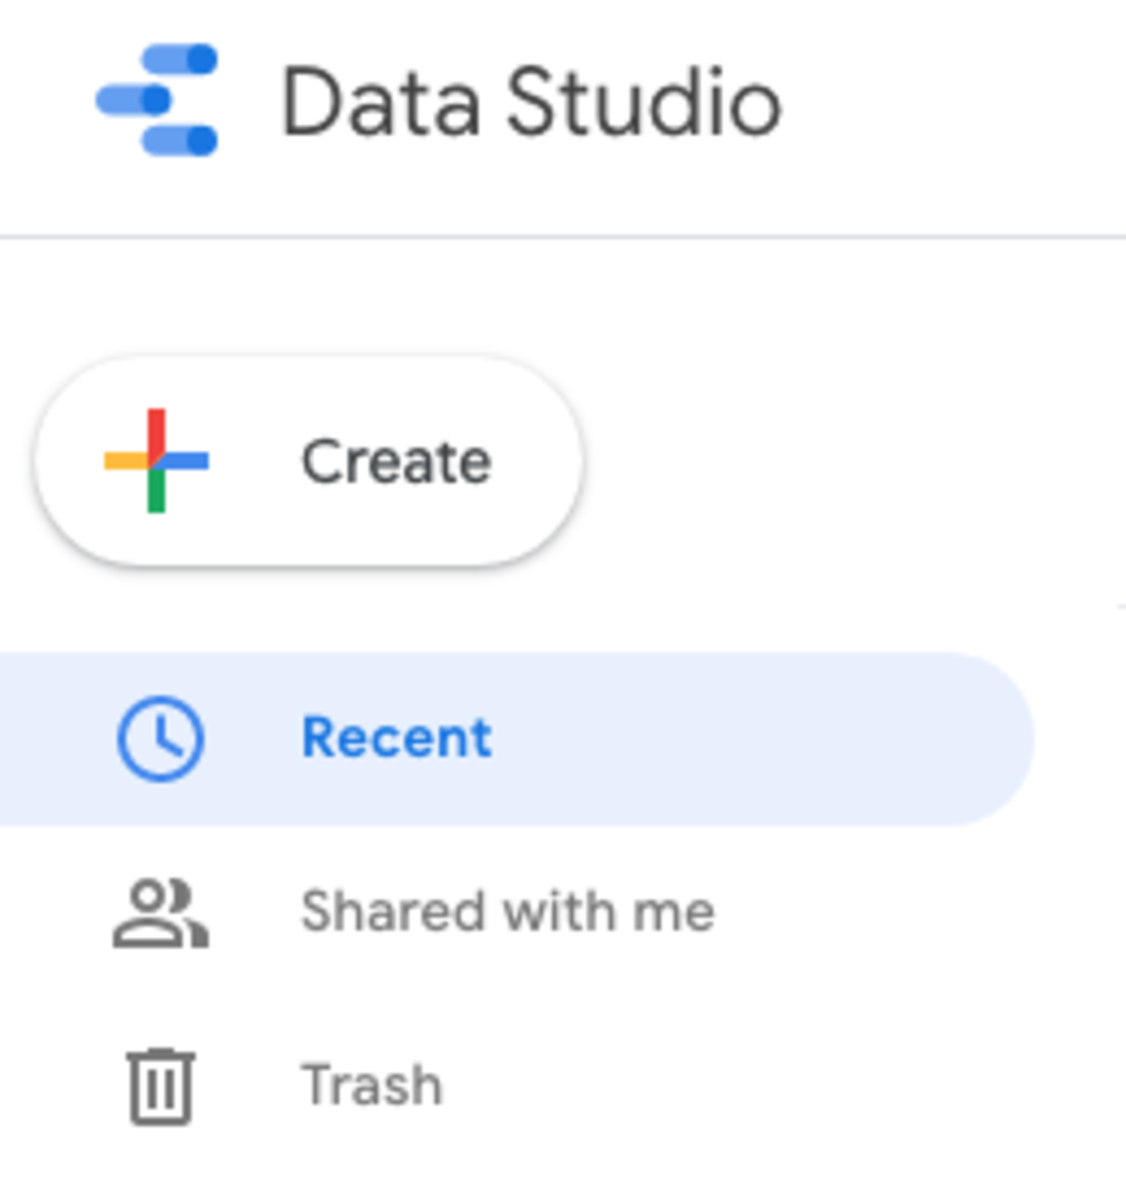
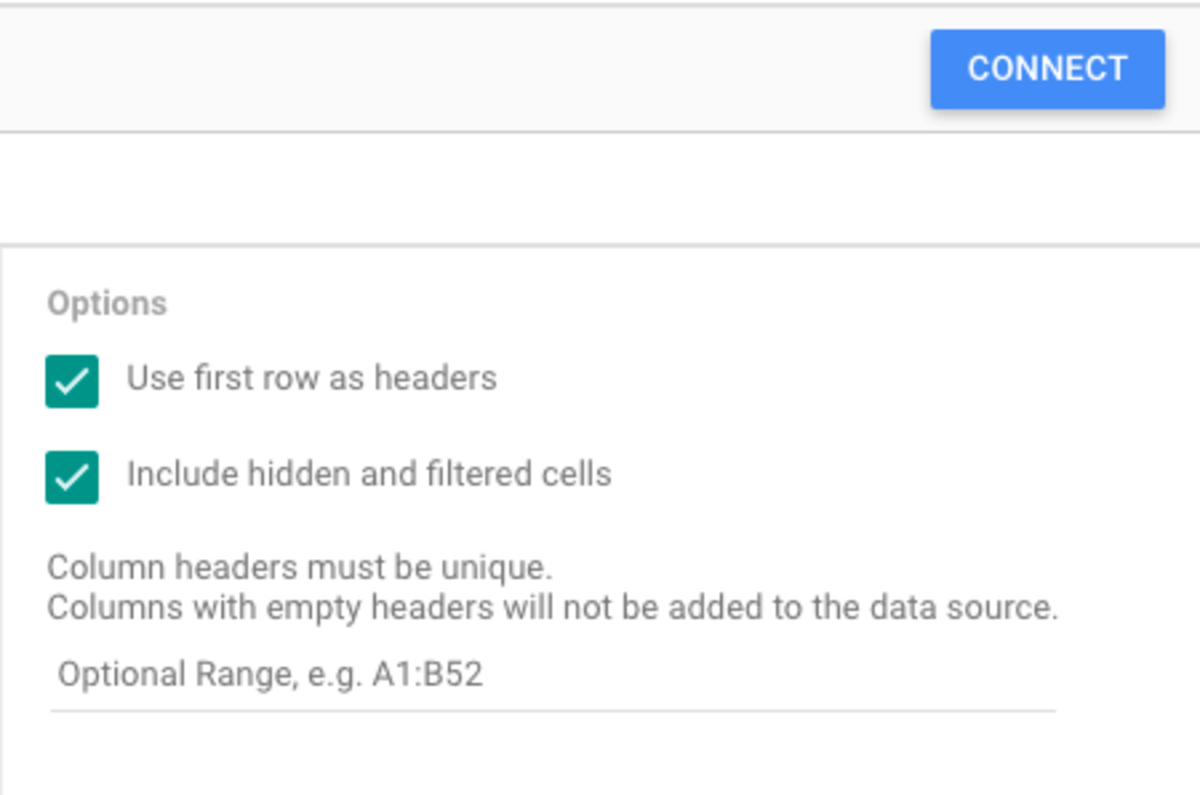
The first step in creating a data source is to establish a connection with the data in Google Sheets. Cells should only contain data The first row of the data should contain column headers After you have signed in to Google Data Studio, click on Create on the top left corner.
Create button
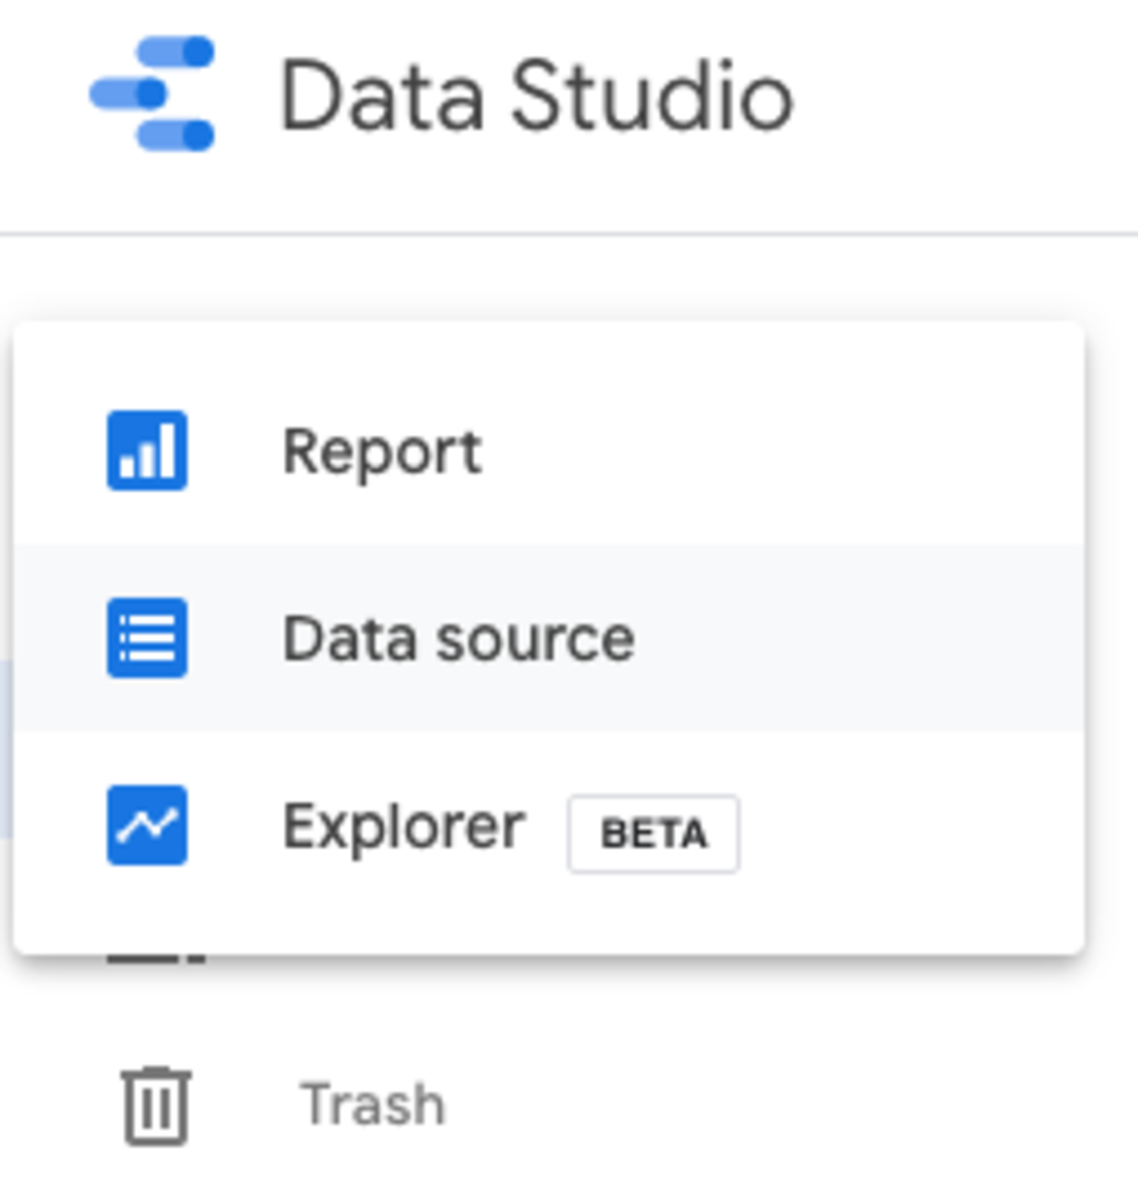
Create Data Source
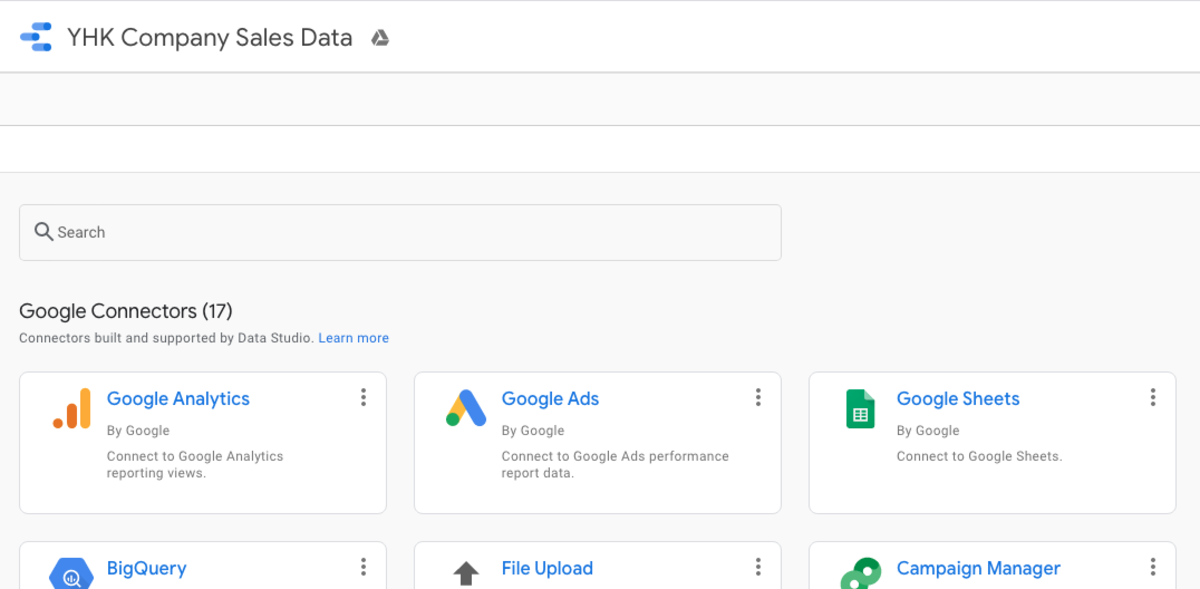
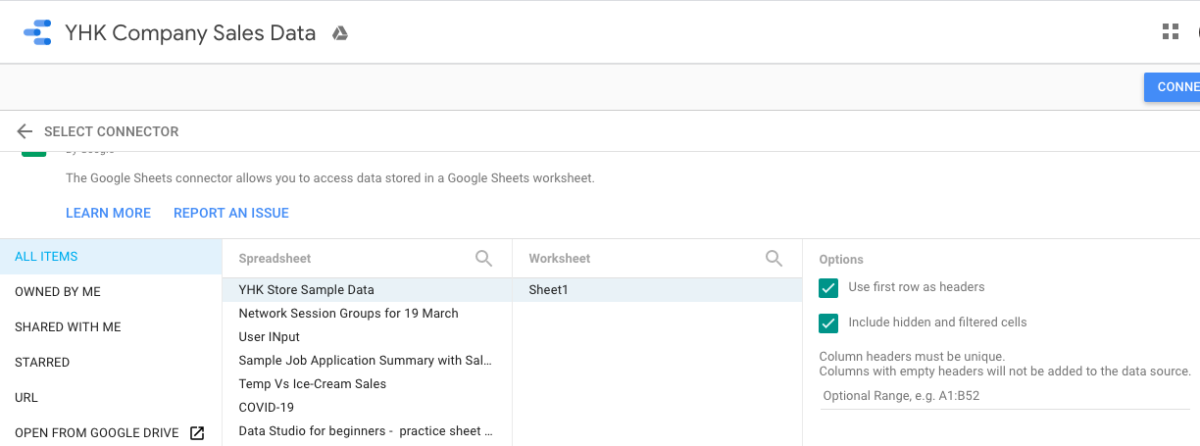
Choose Google Sheets as your Google Data Connector. Choose and type an appropriate name for this Data Set. Browse to the YHK Store Sample Data which you have downloaded under your own Google Account. Ensure
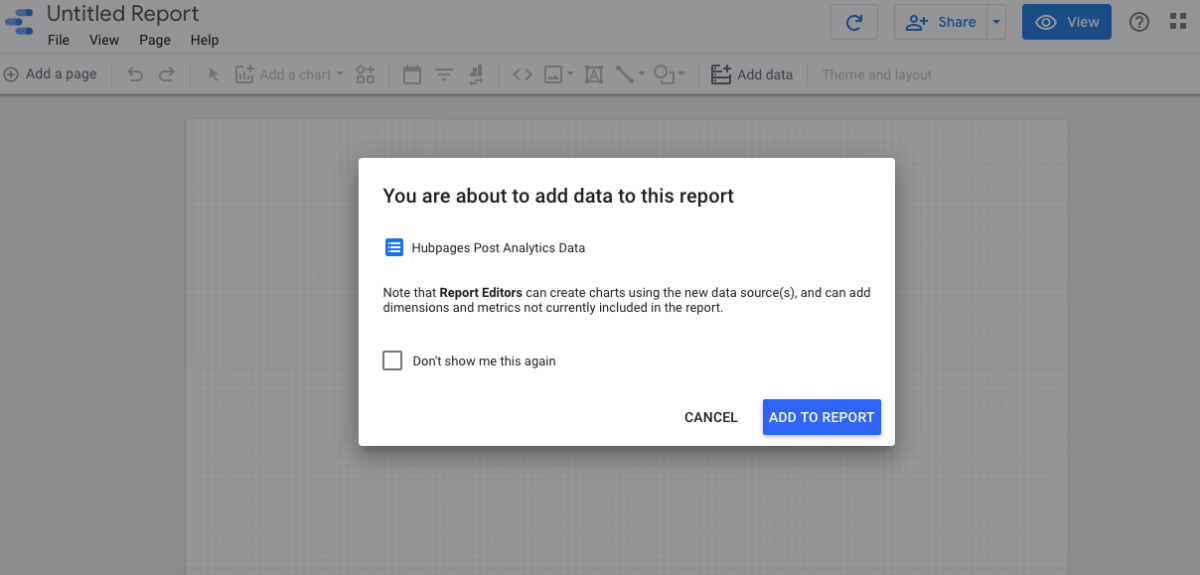
Add Data to Report
Click Add To Report to continue. Congratulations, you have successfully connected to the YHK Store Sample Data. Read on to find out how you can create your first Visualisation Report.
Navigation
Learn How to Use Google Data Studio to Visualise Data Easily Google Data Studio - Getting Started Data Connectors - Connect to Google Sheets Your First Visualisation Report using Google Data Studio Richer Interactive in Google Data Studio About Filter Control In Google Data Studio Using Charts as Interactive Filters in Google Data Studio Managing Data Sources in Google Data Studio This content is accurate and true to the best of the author’s knowledge and is not meant to substitute for formal and individualized advice from a qualified professional. © 2020 Heng Kiong Yap