The growth of an information-based society has made data analytics a popular field of study. Today, every discussion usually revolves around how much data is available on a particular topic. Possessing analyzed data and information in real-time has not only become an essential part of our everyday lives but also dictates how society functions as a whole. Data analytics is everything we see around us. When you stop at a red light and proceed at a green light, that is a result of a data analytic process. When presenting the figures of how many vaccinated people died of Covid-19, that is a data analytic process. Demographic shifts and voting patterns, the number of hours spent on social media—all these are results of a data analytic process. Data analytics is often presented as a complicated process of statistics, figures, diagrams, and graphs, but the truth is, it can be presented just as simply as the color red for danger and the color green for safety. But if data analytics is in some cases a complex process and in other cases a simple interpretation, then who qualifies to be considered a data analyst?
Who Is a Data Analyst?
Technically, any intelligent life form can be called a data analyst if it can examine raw data, identify patterns and trends, and use them to produce useful information, draw conclusions and make informed decisions. Humans are natural-born data analysts. When a baby is born and opens its eyes for the first time, the movement of the eyes is significantly different compared to grownups. This is because the baby is taking in a lot of raw data, examining it, identifying patterns, and using that to create meaningful information and act on it. The more data the baby collects, it uses to create a pattern of how the source of food, protection, and comfort looks like and is able to identify the mother. According to the definition, anyone that can analyze data can be considered a data analyst. However, to accurately qualify to be called a data analyst there are some requirements that have to be met. Basketball and football can be played by anyone on the streets, but those individuals playing on the streets are not listed as basketball players or football players unless they play those sports under widely accepted rules, guidelines, attires, equipment, and place. To qualify to be called a data analyst one needs to attain the right qualifications, use the correct data analysis tools and guidelines, and present the information according to the stipulated rules of data analysis. Data analytics is a wide field of study, in a 24-hour day, humans consume different types of data and information. This means different types of data analytics are needed to navigate our way through society.
Types of Data Analytics
There are generally four types and stages of data analytics:
Descriptive Analytics Diagnostic Analytics Predictive Analytics Prescriptive Analytics
Descriptive Analytics
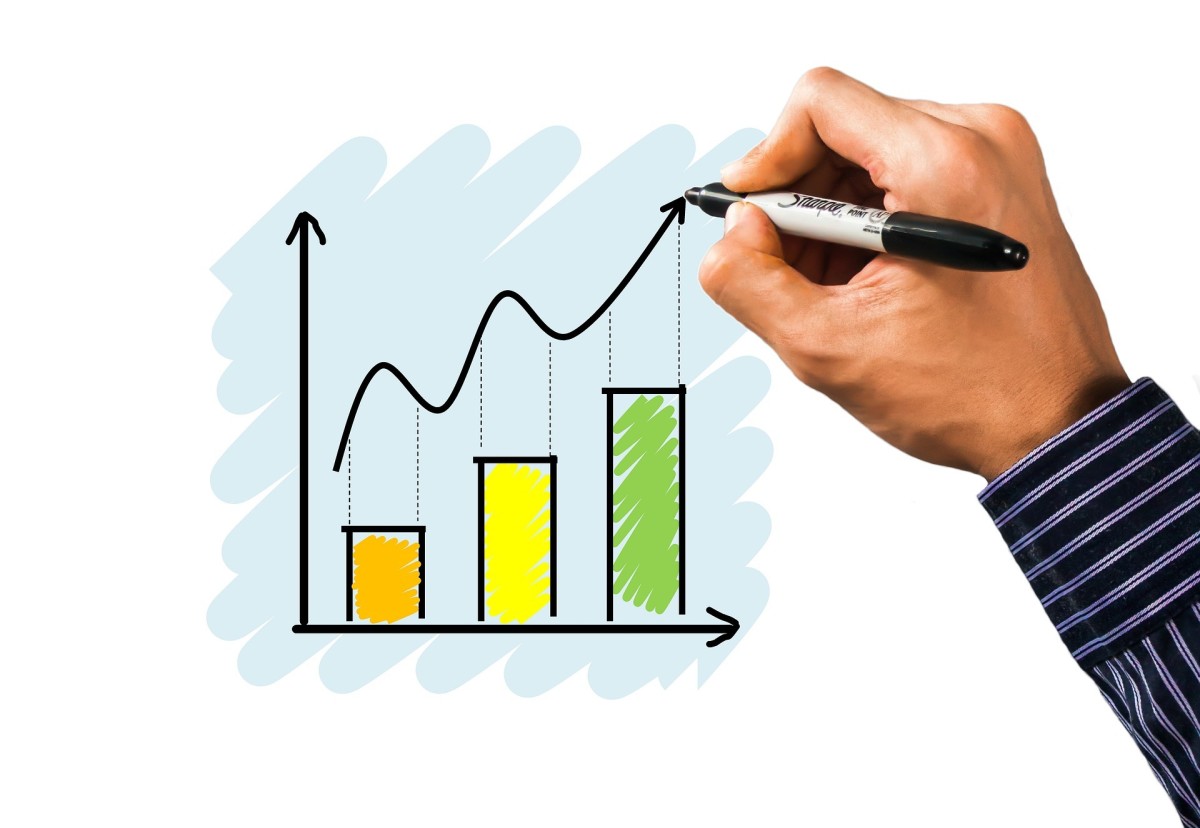
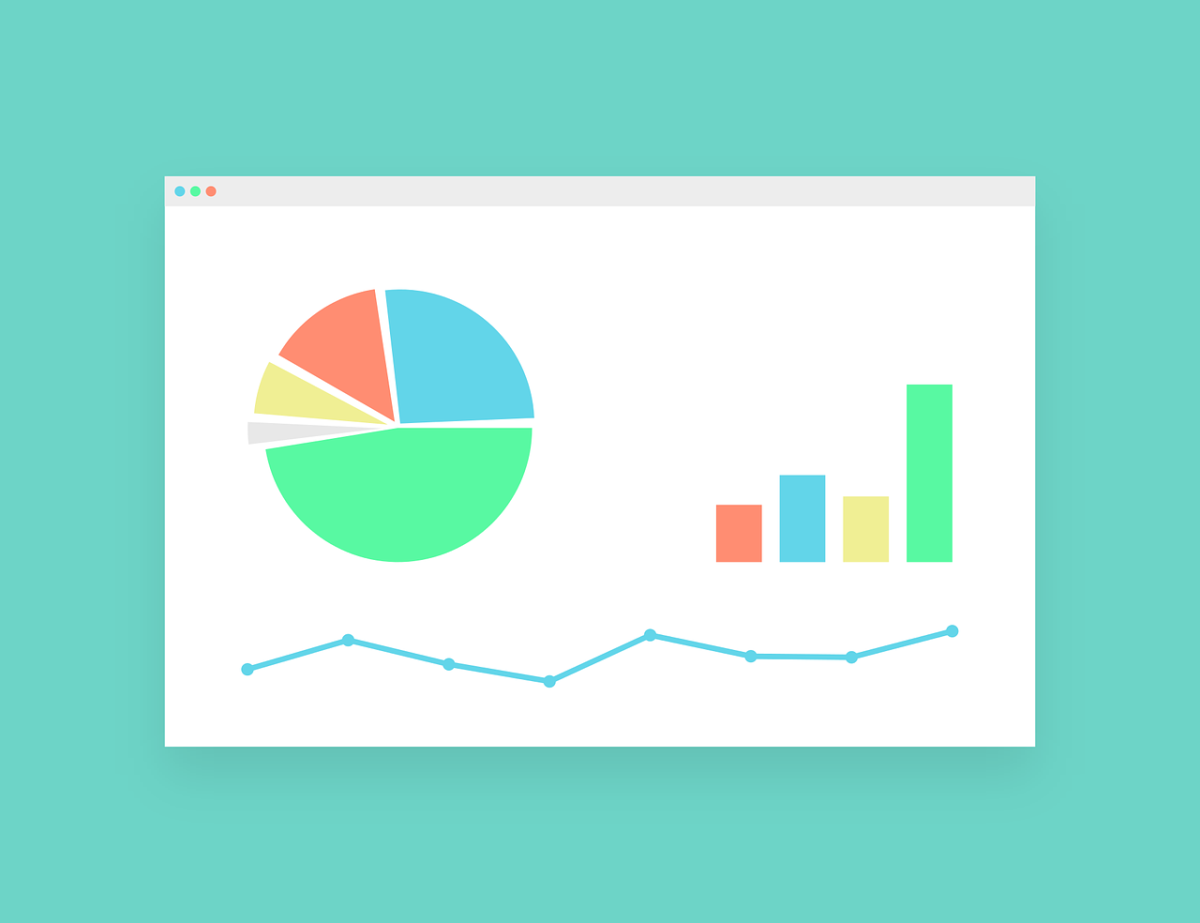
This is the type of data analytics that requires generating information from historical data. It utilizes events of the past to identify specific patterns in the raw data and uses these patterns to create a visual representation of useful information. This analytic is similar to recognizing a roommate in a crowd of people. When you look at your roommate, your memories and past events will help you visually identify your colleague from other strangers. Using the information gathered, you invite your roommate to accompany you on a drinking spree. This is generally the first stage and the simplest form of data analytics and lays the foundation for other types of analytics to be performed at later stages. Descriptive analytics is visually represented by pie charts, bar charts, line graphs, or tables. They depict events that have already happened. In business, these events can be the number of sales in a week or how much revenue was generated in the first quarter. On social media, this can be the number of comments, shares, or likes on a particular post, video, or picture.
Diagnostic Analytics
Diagnostic analytics is an advanced type of data analytics that builds on the information provided after a descriptive analysis has been conducted. Diagnostic analytics tries to explain why an event took place. After a drinking spree with your roommate, you notice that your colleague vomited all over the flat the following morning. Using diagnostic analysis you can be able to connect the two events and conclude that it is the drinking spree that caused that early morning vomiting event. This is usually the second stage of analytics, and it is dependent on the information generated during the descriptive analysis stage. A diagnostic analysis will present information on why an event occurred. This stage involves drilling down on the information and identifying patterns and relationships. A valuable tool at this stage is correlation analysis, which tries to identify relationships that exist in the data or information. A company’s increased sales figures can be correlated to reduced prices during a similar time frame. The popularity of a TV show can be correlated to an increase in the number of new subscribers joining a streaming service. If a crime occurs, law enforcement will use diagnostic analytics to try to explain the motives of the perpetrator. If the Covid-19 cases are dropping, does it mean the vaccines are working? Is there a correlation between the two events? Diagnostic analytics tries to answer those questions. The news is a combination of descriptive and diagnostic analytics.
Predictive Analytics
Predictive analytics is the third stage of data analytics. It is not possible to predict an event when several factors are still unknown variables. Predictive analytics uses the information from the first two stages and predicts what is likely to occur from that information. If you have established that every time you go out on a drinking spree with your roommate, a vomiting event occurs the next morning. Then it is easy to predict the outcome of a drinking spree with your colleague. This stage uses advanced analysis tools such as regression analysis and forecasting. It requires a considerable amount of data and information to draw predictions. Predictive analytics helps larger organizations forecast their sales, predict the impacts of marketing campaigns, and foresee demands for specific products. Satellites can predict weather patterns using information from the first two stages of analytics. Election analysts can predict voting patterns by analyzing previous election results. Social media and streaming service providers use predictive analytics to customize and recommend content that the user might be interested in based on the type of content they previously showed interest in.
Prescriptive Analytics
Prescriptive analytics is the final stage of data analytics. This stage sets what should be done with the information and data presented during the first three stages of data analysis. The accuracy of the information generated at this stage is dependent on the accuracy and quality of data generated in the preceding stages. Returning to our previous example, you have correctly established and predicted that every time you go out on a drinking spree with your roommate, there is vomit all over the flat the next morning. The final stage is to decide what you are going to do with that information. Are you going to stop going on drinking sprees with your roommate? Are you going to advise your roommate to reduce the number of glasses consumed? Is the drinking spree worth it? Is the constant scent of vomit at the flat acceptable? This is the stage where you use all the information gathered in the previous stages of analysis and make an informed decision. This advanced stage involves analyzing the graphs, conducting simulations, and machine learning. This is the most essential part of data analytics because the information generated is essential for decision-making, policy formulations, and creating goals and objectives. If the government wants to introduce lockdowns to reduce the spread of the virus, decisions are made at this stage of analytics. If a streaming service decides to cancel a TV show, this is where decisions are made.
The World of Data Analytics
Data analytics is not as complex as most people perceive it to be. It is a simple everyday activity that we all undertake without knowing it. The complexities of data analytics are the tools we decide to use. If you see dark clouds and rightly predict that a heavy storm is coming, you are performing a data analytics process. If a meteorologist uses satellites to correctly predict a heavy storm, that is also data analytics. Data analytics is a process of simplifying huge amounts of data and presenting it in a way that is meaningful and easy to understand. It simplifies the data and information we see around us and creates a better understanding of the world we live in.
Additional References
“What is Data Analytics?” (2022, April 15). Masters in Data Science.
This content is accurate and true to the best of the author’s knowledge and is not meant to substitute for formal and individualized advice from a qualified professional. © 2022 AL