Step 1. Enable Excel Data Analysis ToolPak Step 2. Finding Bin Width and Interval Step 3. Open Data Analysis ToolPak Step 4. Choose Histogram Option Step 5. Review Histogram Results
Step 1. Enable Excel Data Analysis ToolPak
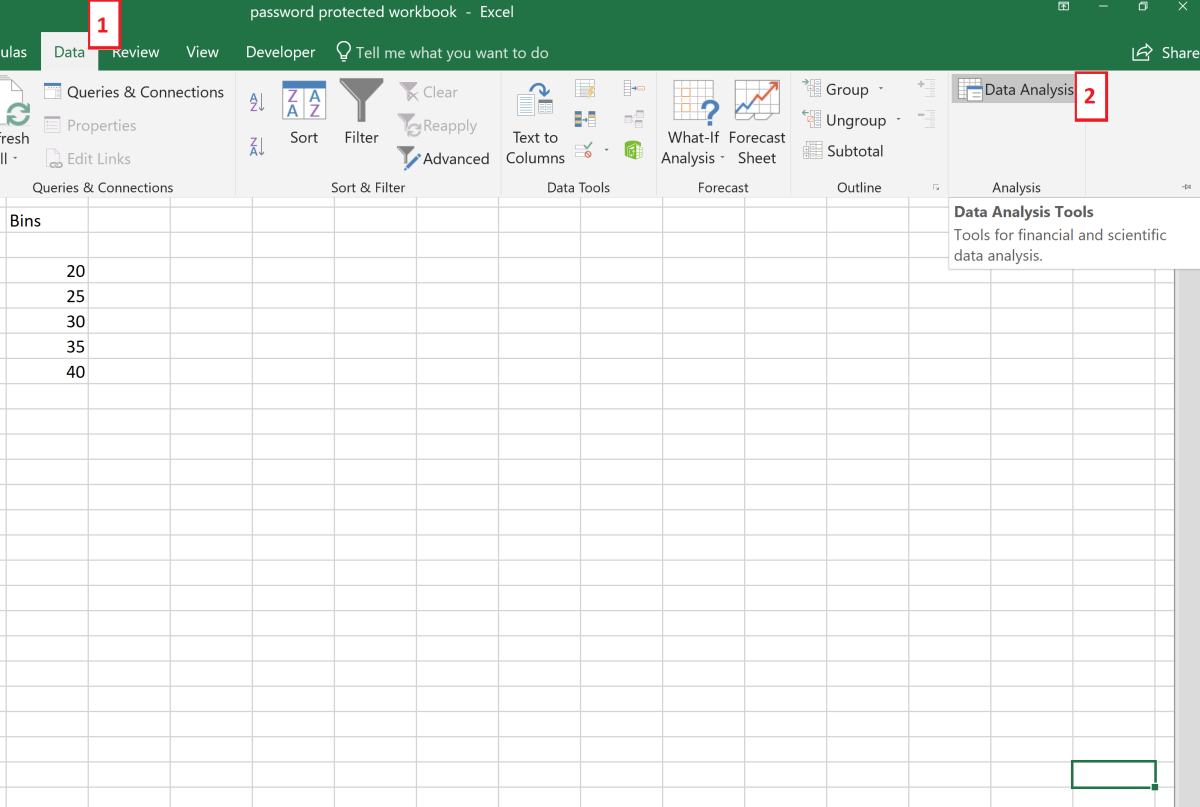
If you have never used the Data Analysis ToolPak, it is probably inactive on your Excel program. You can check to see if you have it by first clicking on the data tab. Next, look for the analysis group on the far-right side of your screen. If the data analysis option does not exist use the following steps to activate this add-in. You should now be ready to use the Data Analysis ToolPak from the data tab in the analysis group.
Step 2. Find Bin Width and Interval
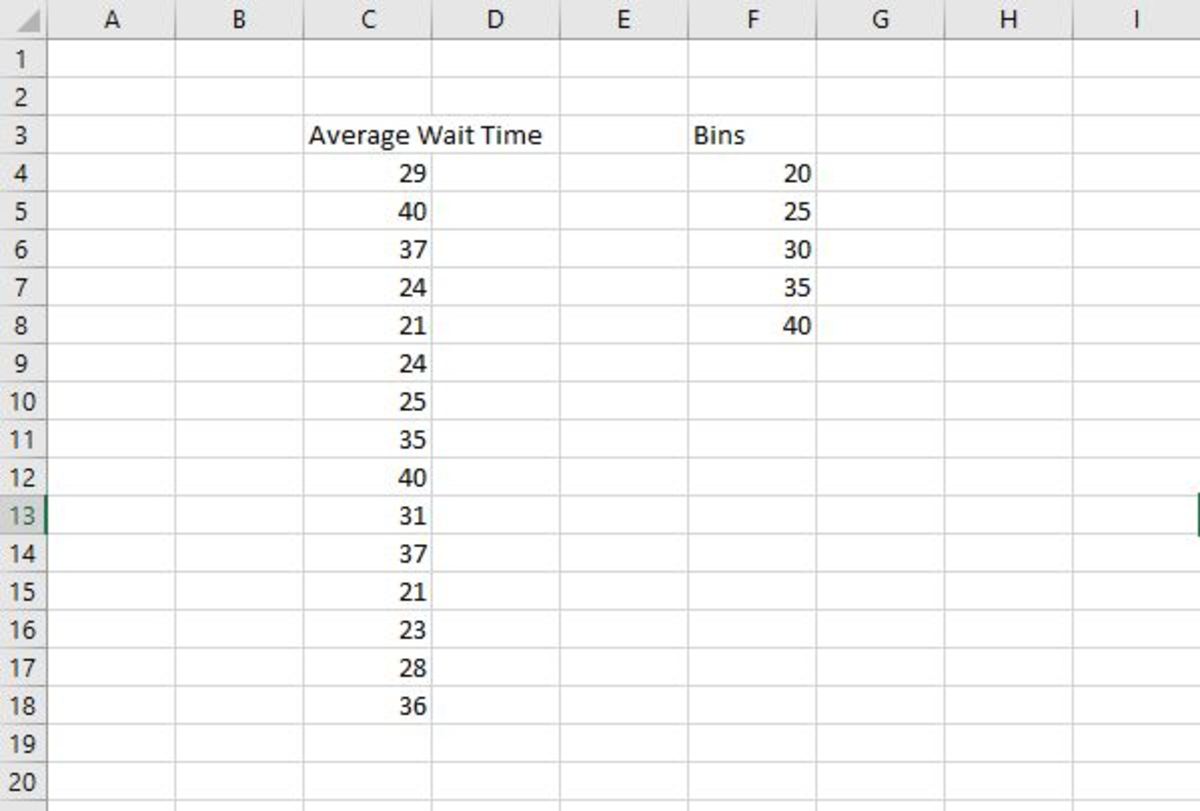
As stated above, there are two sources of data (variables) that are needed to create a histogram. The Data Analysis ToolPak in Excel has options that help with common types of data analysis. To get started using this tool to build a histogram, you need a data set and data detailing your bin configuration for that data. The bins should be configured to evenly distribute the data. Both the data and bins need to be aligned in columns. Bin width should be considered carefully. There are several rules of thumb to use when creating your bins for a histogram. One good one to go by is Juran’s guidelines. To follow these guidelines, the following steps need to be taken: These guidelines are just a rule of thumb. As you can see below, I have added an additional bin for preference.
Step 3. Open Data Analysis ToolPak
Now the Data Analysis ToolPak can be opened to create the histogram. Click on the data tab followed by clicking on the data analysis button in the analysis section of the Excel ribbon.
Step 4. Choose Histogram Option
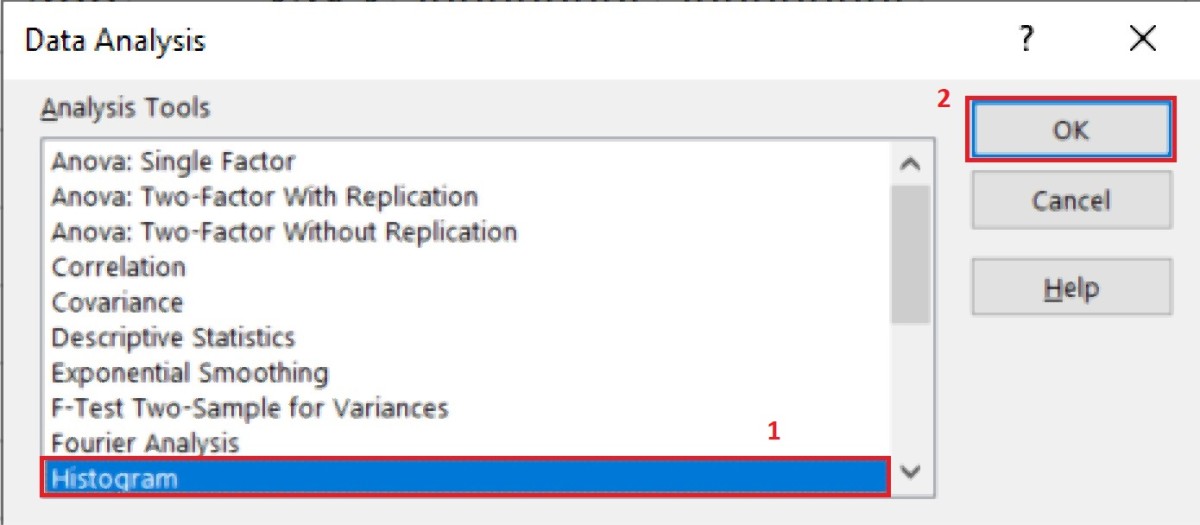
After the data analysis window appears, the histogram option needs to be clicked on. Next, click on the OK button.
Step 5. Input Data
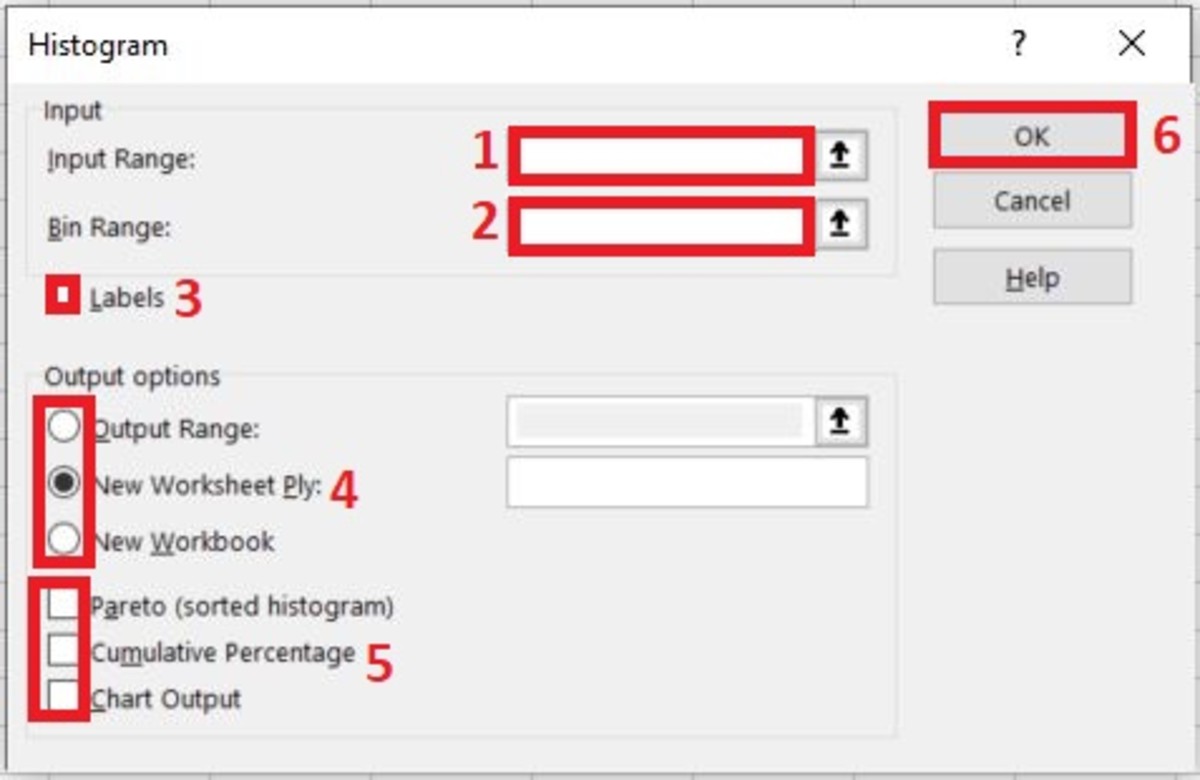
There are several steps to input data into the analysis tool highlighted below:
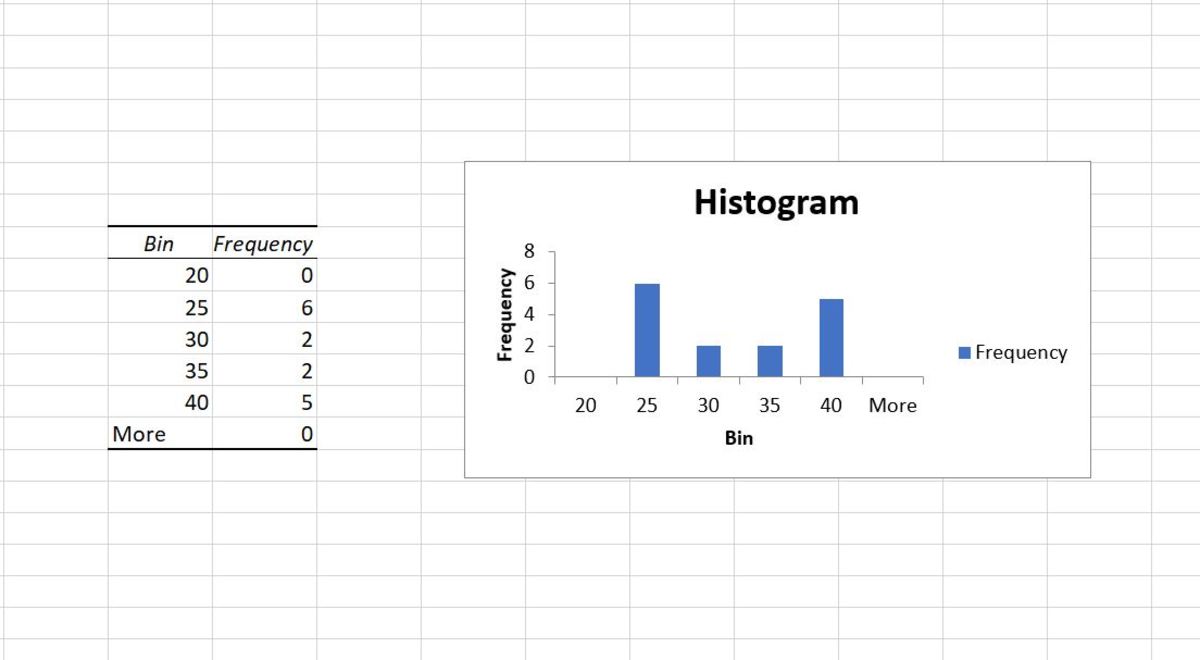
Step 5. Review Histogram Results
If the chart is the only selection that is to the printed, a chart and the corresponding histogram will be printed. This can be seen below.
Additional Results
If you decide that you want your histogram output to have more details like a Pareto chart, select all three options found below.
A complete frequency distribution table A Pareto chart Cumulative markers on the graph
A histogram with all three options is shown below. This content is accurate and true to the best of the author’s knowledge and is not meant to substitute for formal and individualized advice from a qualified professional. © 2019 Joshua Crowder