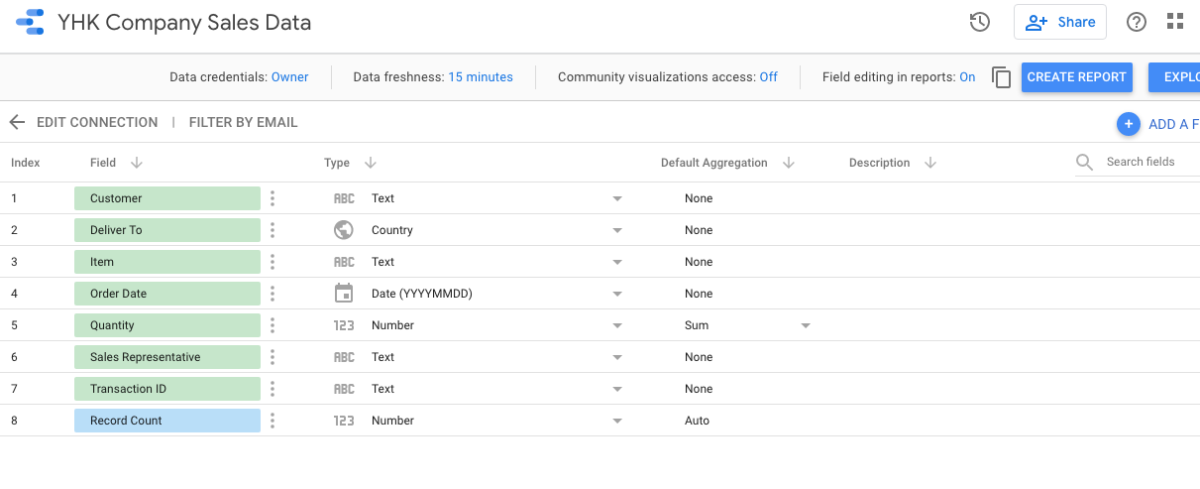
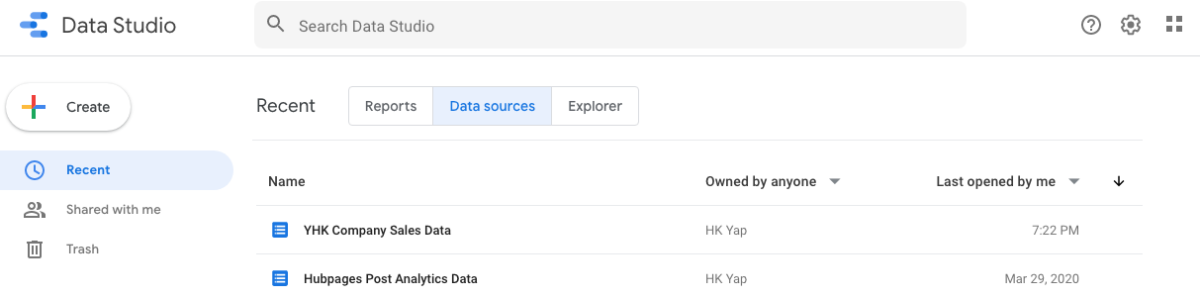
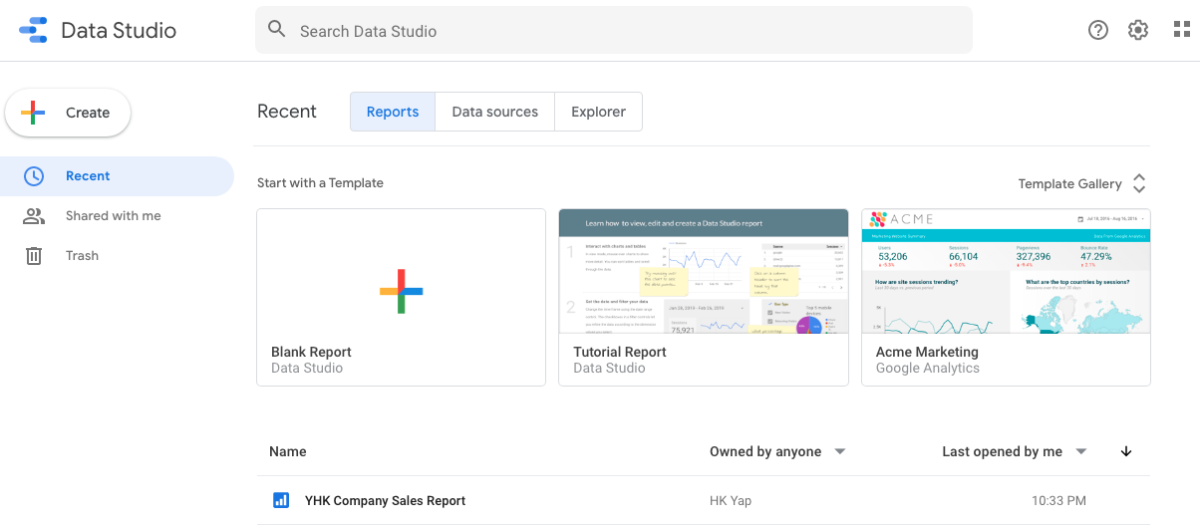
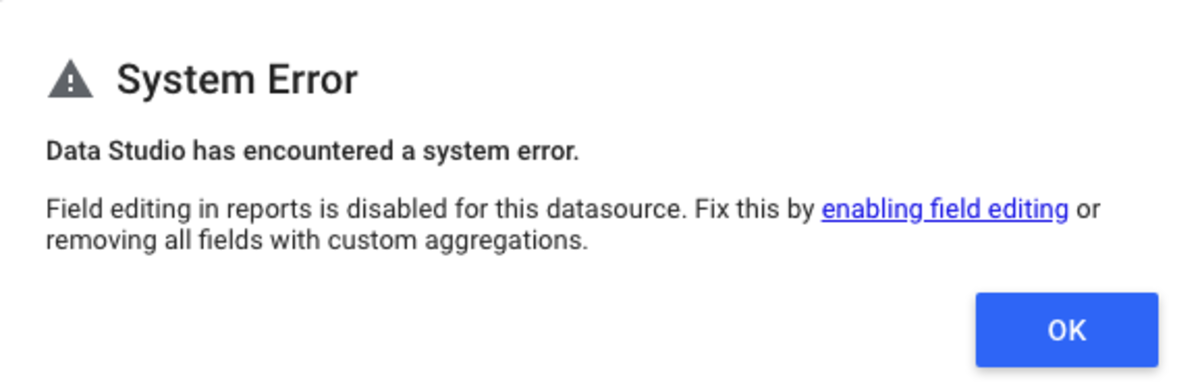
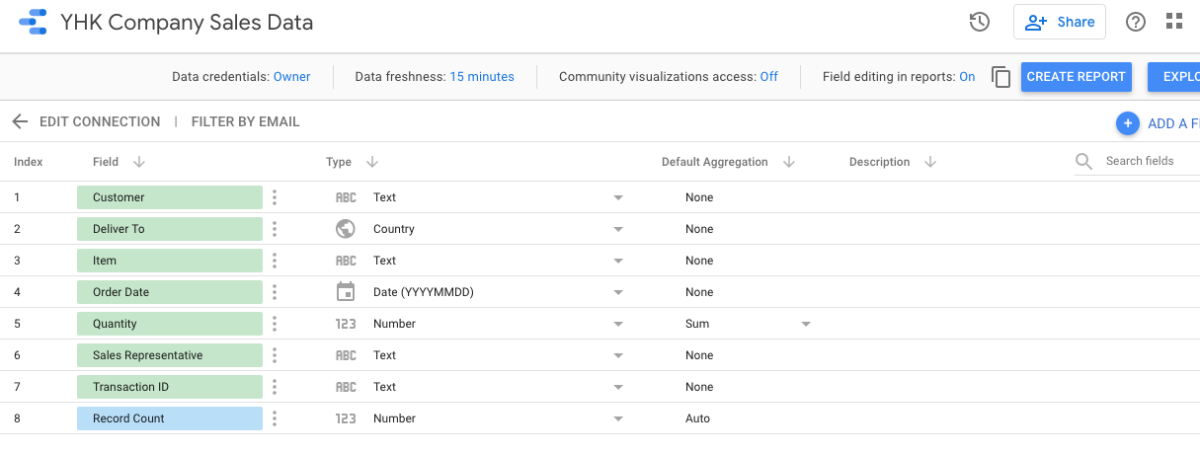
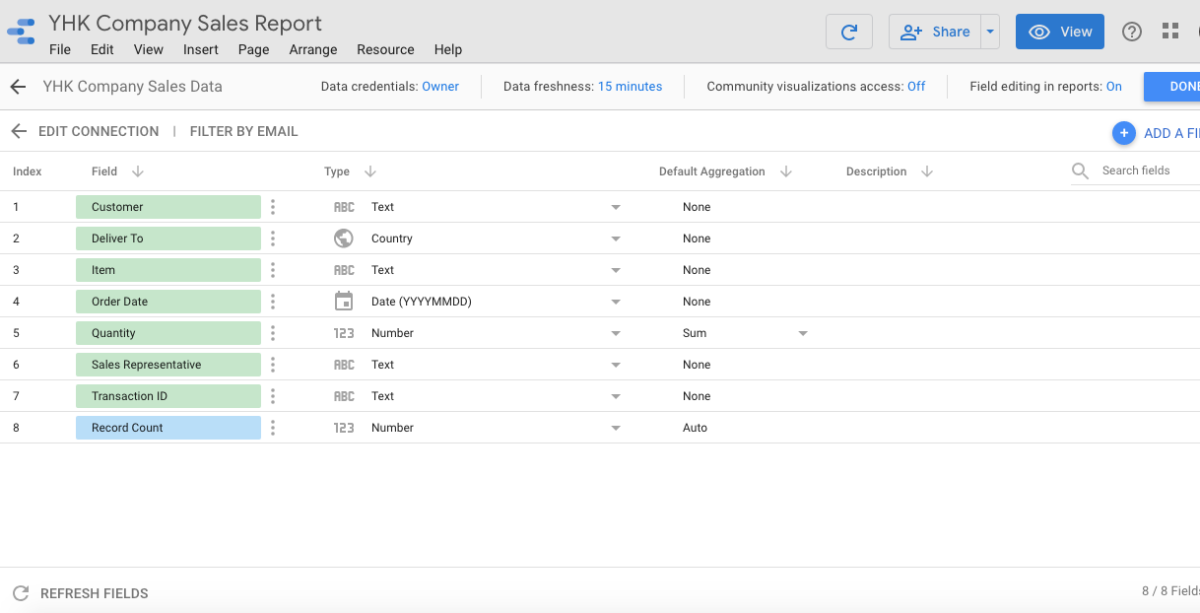
Go back to the homepage of Google Data Studio. Click on the data source “YHK Company Sales Data”. Notice that the Data Freshness is shown as 15 minutes. This means that data source checks for fresh data every 15 minutes. Different types of reports have different data refreshness requirements; highly dependant on the type of Data Sources you are connected with. Visit Google Support for Data refresh rates by Connector. Click the three horizontal blue bars to go back to Google Data Studio’s homepage. By default, the field names as appeared in the Report matches the underlying data. Google Data Studio By setting the Field Editing in Reports to be ON, you allow you as the Report editor to change field definitions at the chart level. Click on YHK Company Sales Report. An error has occurred. Turn “Field editing in reports” back to ON.
Field Editing in Reports: ON
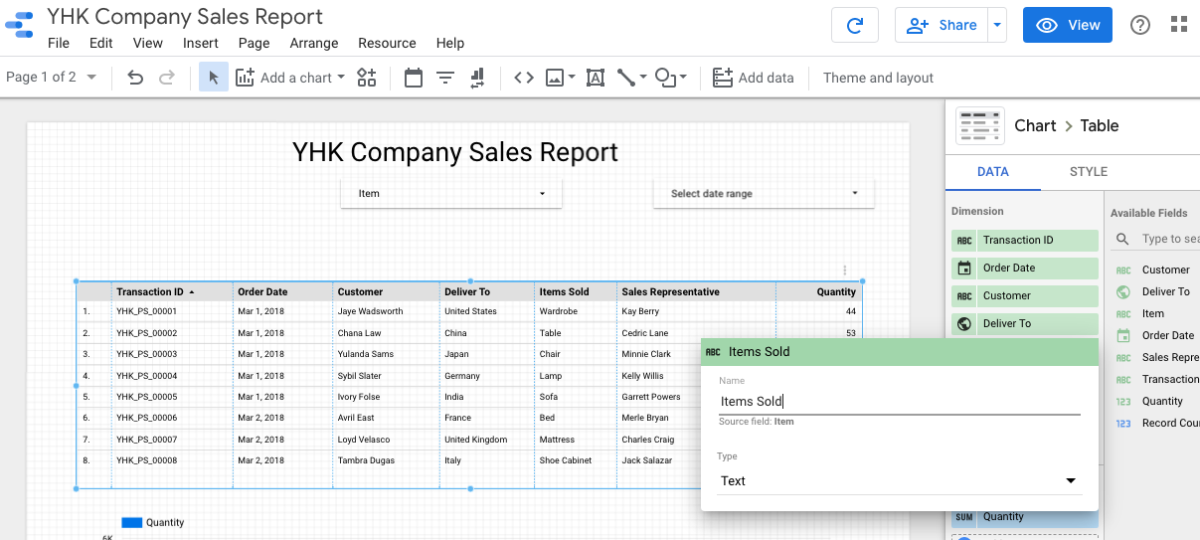
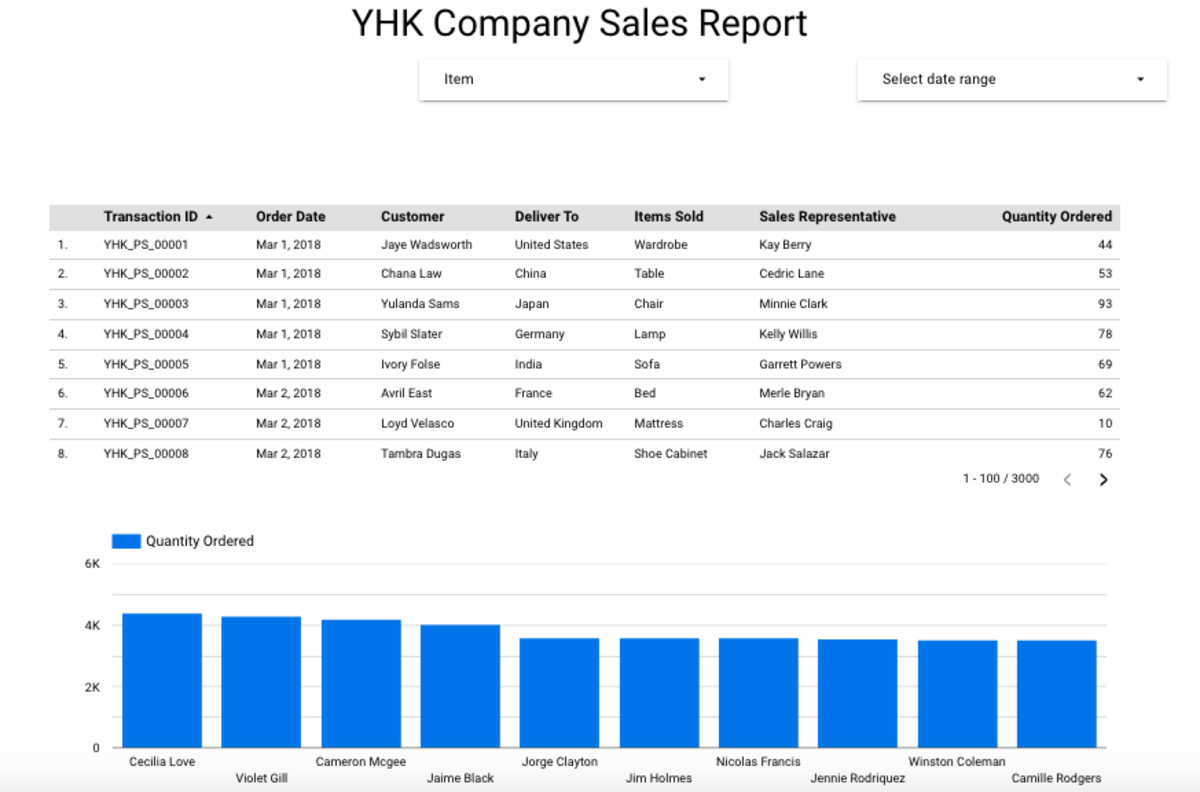
Open up your Report in Edit Mode. Switch to Page 1 of your Report. Click on the Pencil icon next to “Item” and change its name to “Item Sold”. Notice that Table in your Report has been updated with the new name. However, renaming here does not change anything in the original data sets at Google Sheets.
Manage Added Data Sources
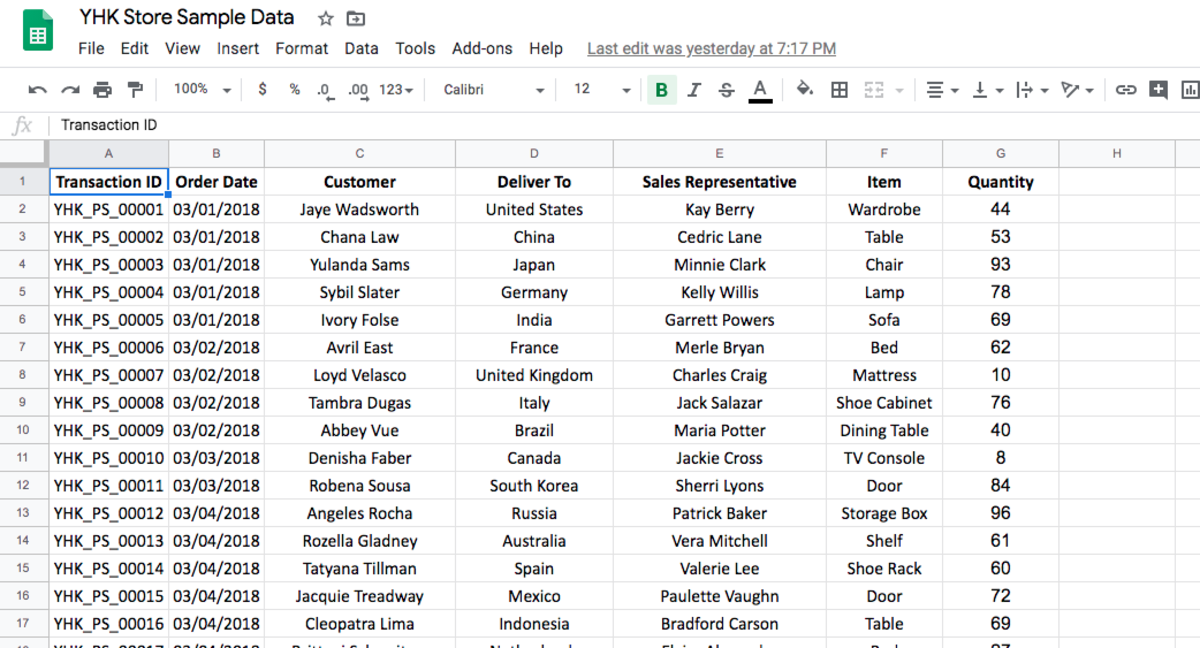
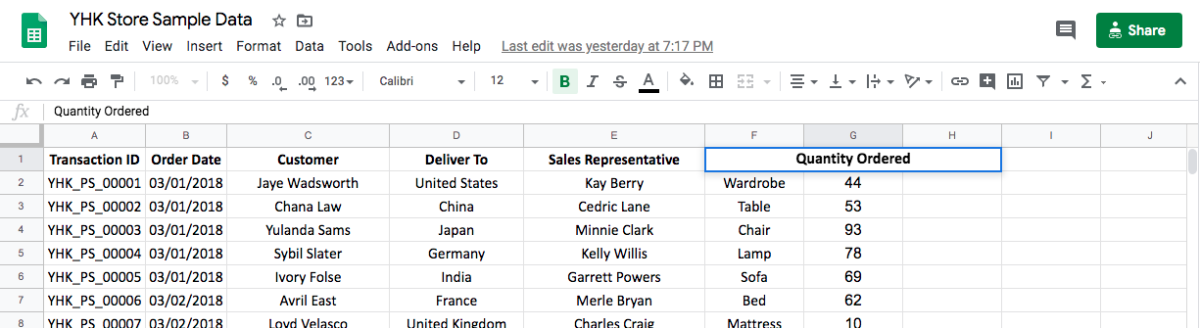
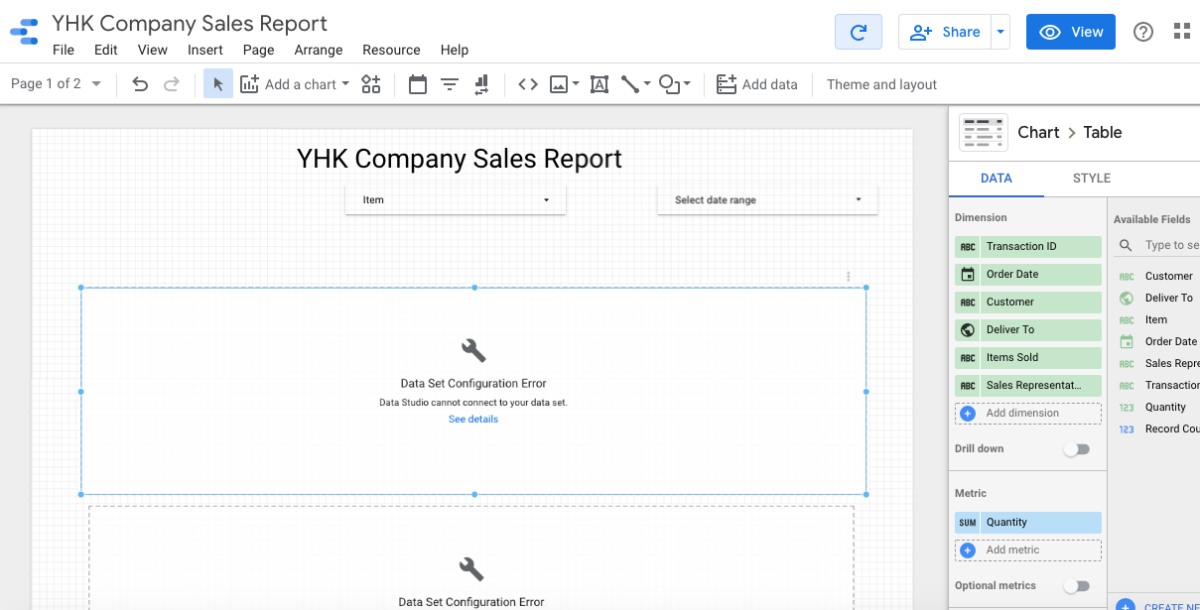
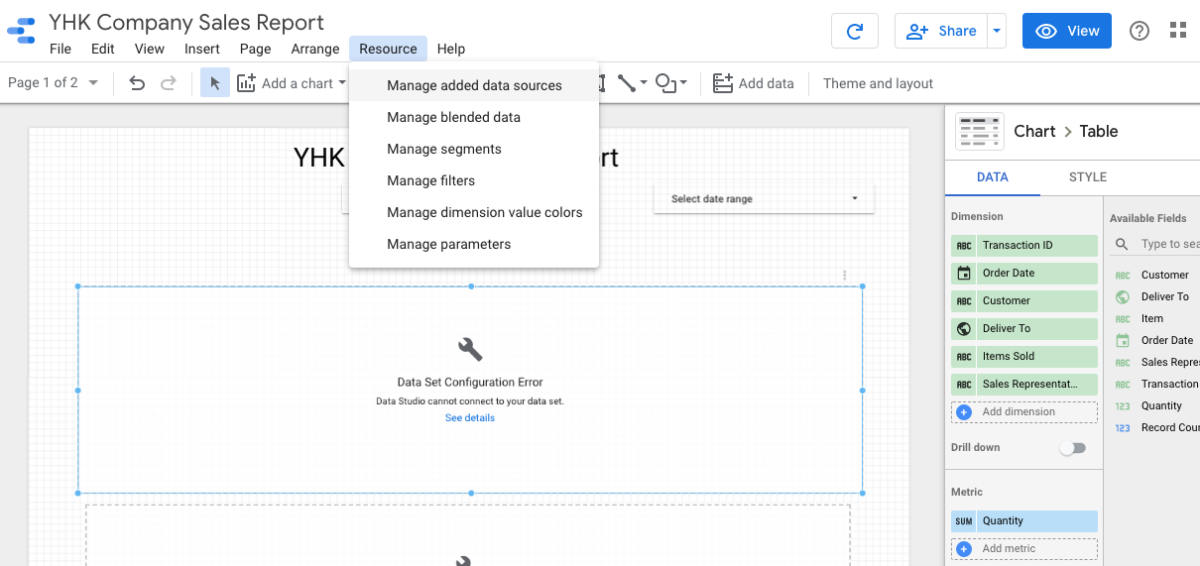
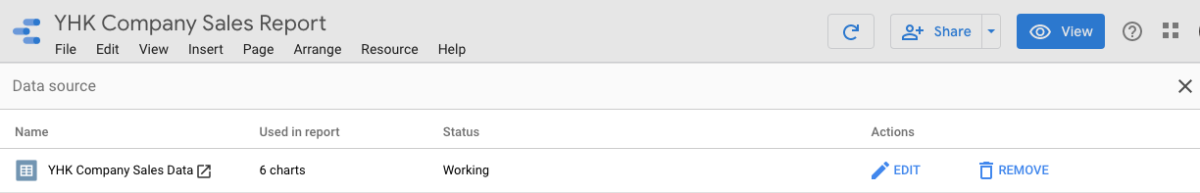
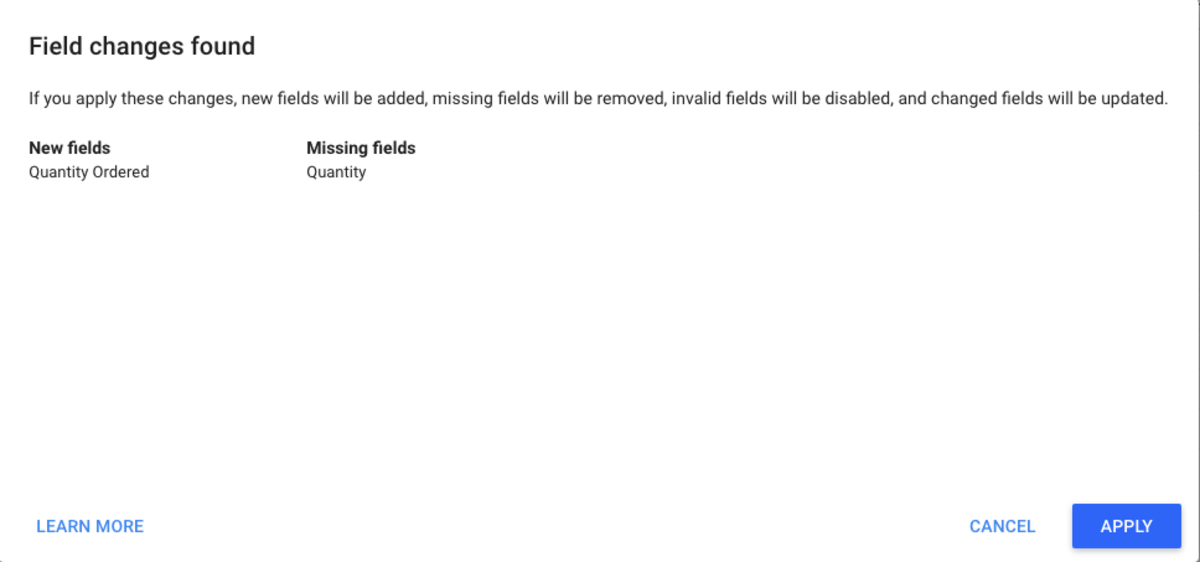
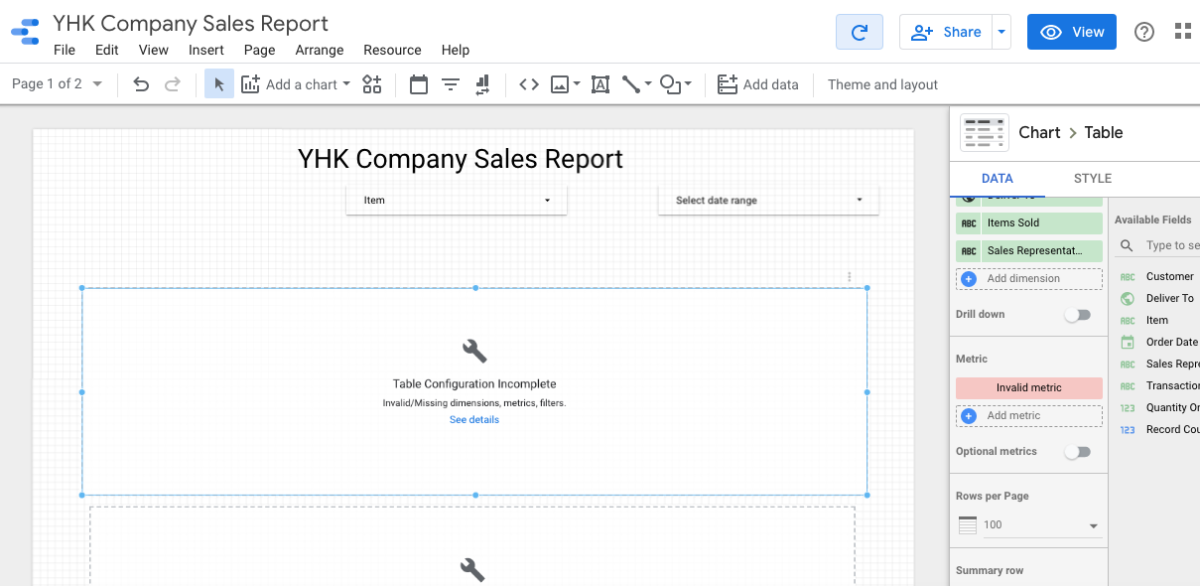
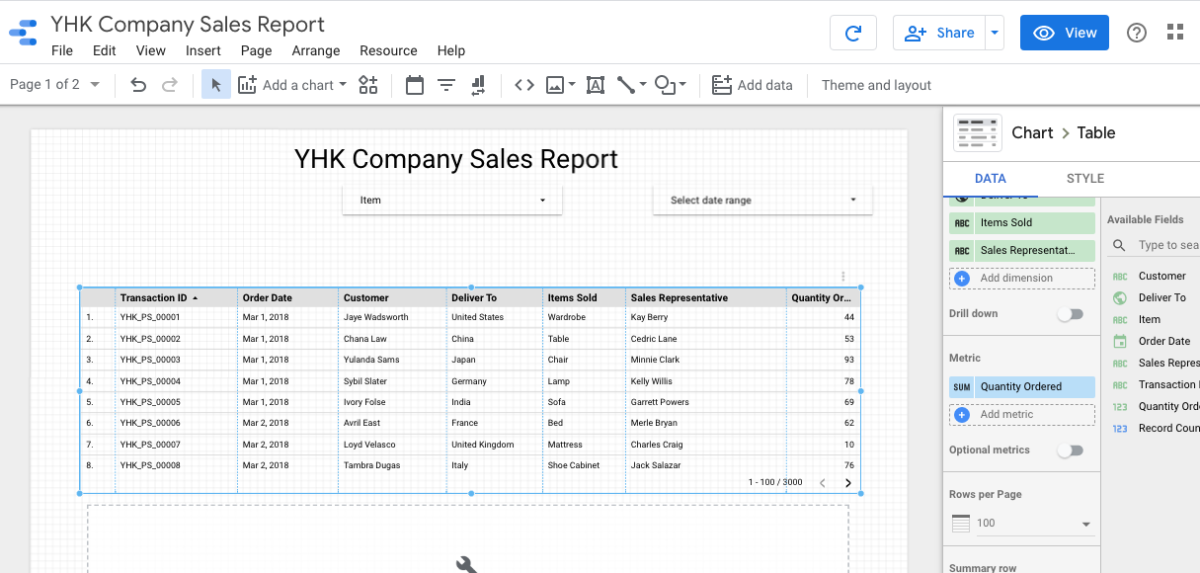
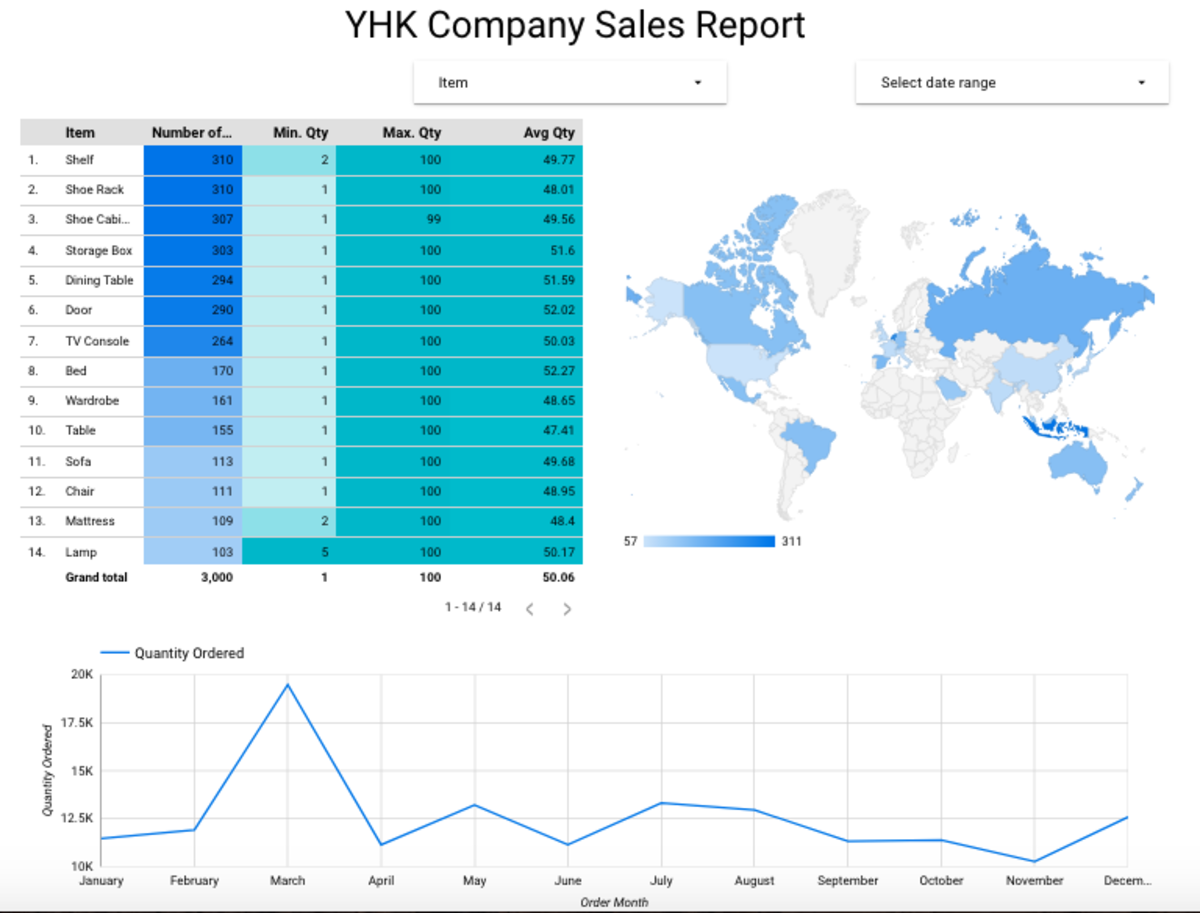
Next up, we are going to try something new. Let’s make a change at Google Sheets and learn how can the change be effected at Google Data Studio. Change “Quantity” to “Quantity Ordered” in Google Sheets. To fix this error, do the following: In “Edit” mode, click Resource -> Manage Added Data Sources. Click “Edit” next to the YHK Company Sales Data. Click “Refresh fields”. Note the change which Google Data Studio has detected. Click “Apply” to continue, followed by “Done” and then “Close”. You still get the same error message. That is because you have to manually add the “new” metric to the Report as shown below. Go through, one by one, all the charts which have been affected by this change. Manually add the ’new’ metric to the Reports. The charts are now back to function with the updated new field name.
Navigation
Learn How to Use Google Data Studio to Visualise Data Easily Google Data Studio - Getting Started Data Connectors - Connect To Google Sheets Your First Visualisation Report using Google Data Studio Richer Interactive in Google Data Studio About Filter Control In Google Data Studio Using Charts as Interactive Filters in Google Data Studio This content is accurate and true to the best of the author’s knowledge and is not meant to substitute for formal and individualized advice from a qualified professional. © 2020 Heng Kiong Yap