Components Required
NodeMCU X 1 DTH11 Sensor X 1 Jumper Wires X 3 (Male-To-Male) Breadboard X 1
Let’s Begin
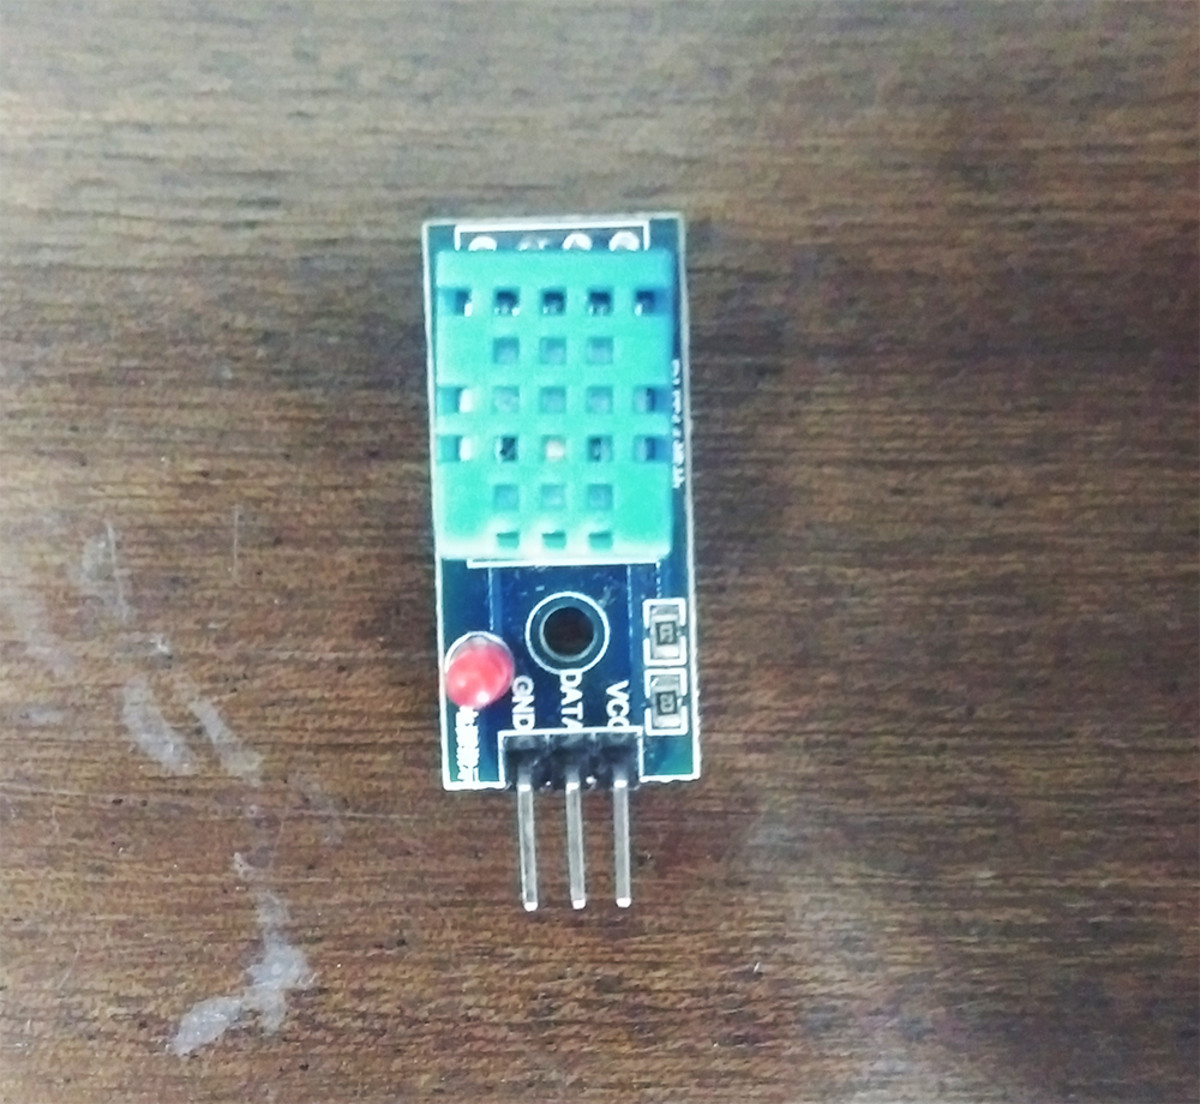
In this tutorial, I am using the DHT11 sensor which has three pins, DATA, VCC, and GND as shown in the following figure. You can also use the other DHT11 sensor which has 4 pins.
1. Circuit
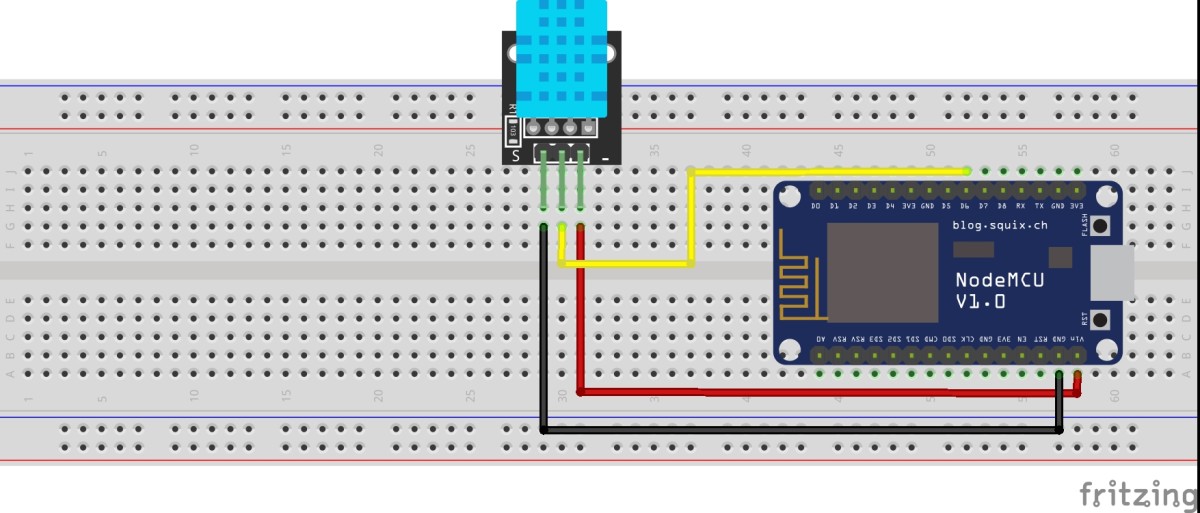
Connect the DATA pin of the DHT11 sensor to the NodeMCU D6 pin and VCC, GND to Vin, and GND pins respectively of NodeMCU. The circuit diagram is shown below.
2. Arduino Code
Now upload the following Arduino code to NodeMCU. Please remember to specify your WiFi SSID and password and also username and KEY of the Adafruit IO (AIO) platform.
3. Build User Interface
Our next step is to build the user interface (UI) where we can display the data published by the sensor node. Please keep in mind that I have added a 1-minute delay in code (i.e. in line 93) above while publishing the values to the AIO platform. Don’t upload values very frequently, otherwise, your account may be blocked for a few seconds!
To create UI, log on to your Adafruit IO account.
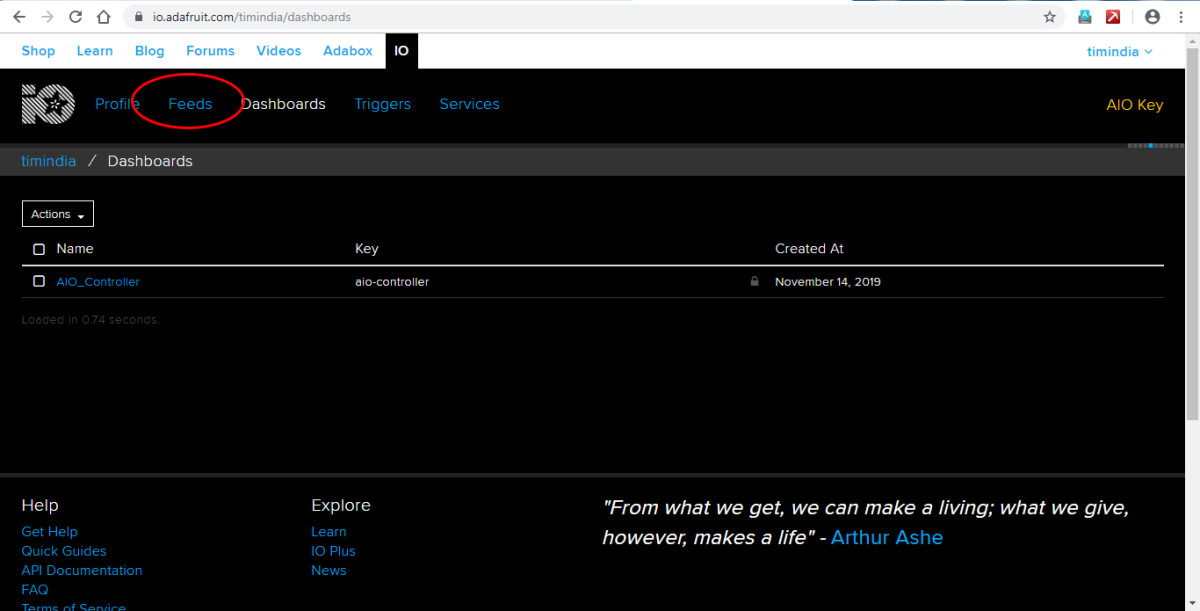
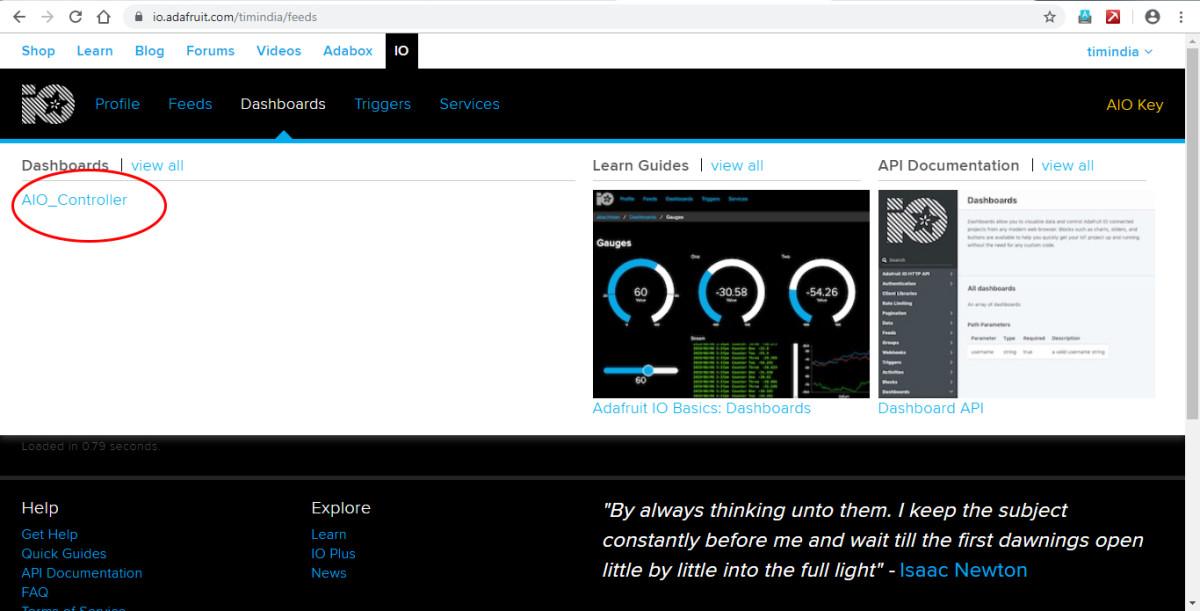
After you log in, you will see the AIO_Controller dashboard. If you have not created the dashboard then please do so now.
The first thing we need is to create the Feeds where our data will be published. The Feeds are the MQTT topics. These topics are then bound to our UI which will display data graphically. In this tutorial, I’ll show another method to create feeds.
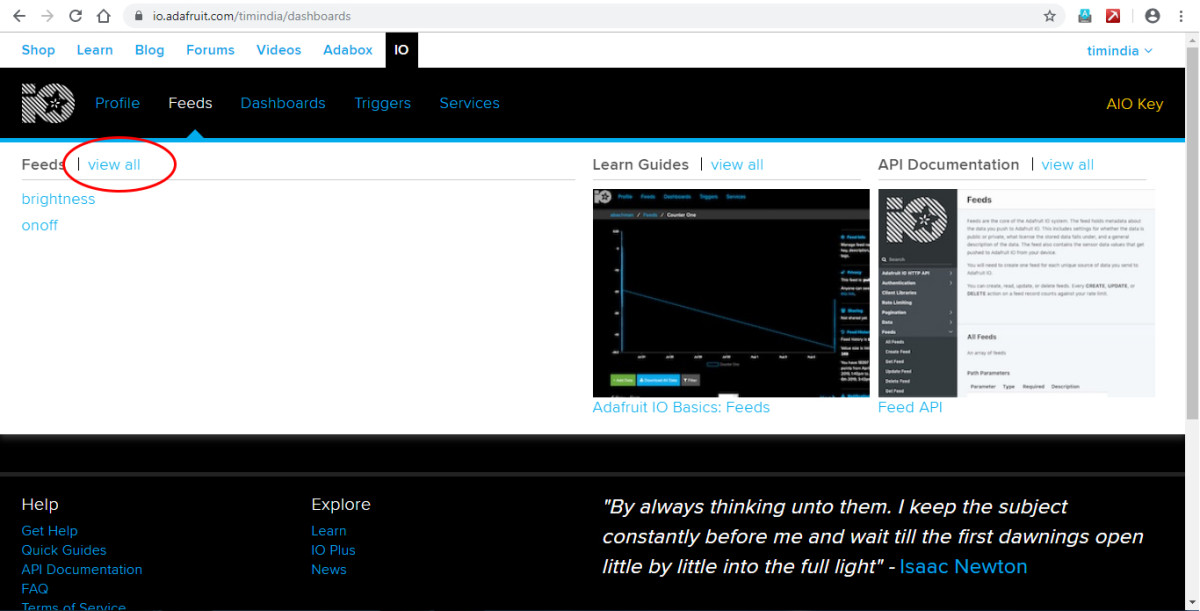
For creating feeds go to Feeds->View All as shown in the following figure.
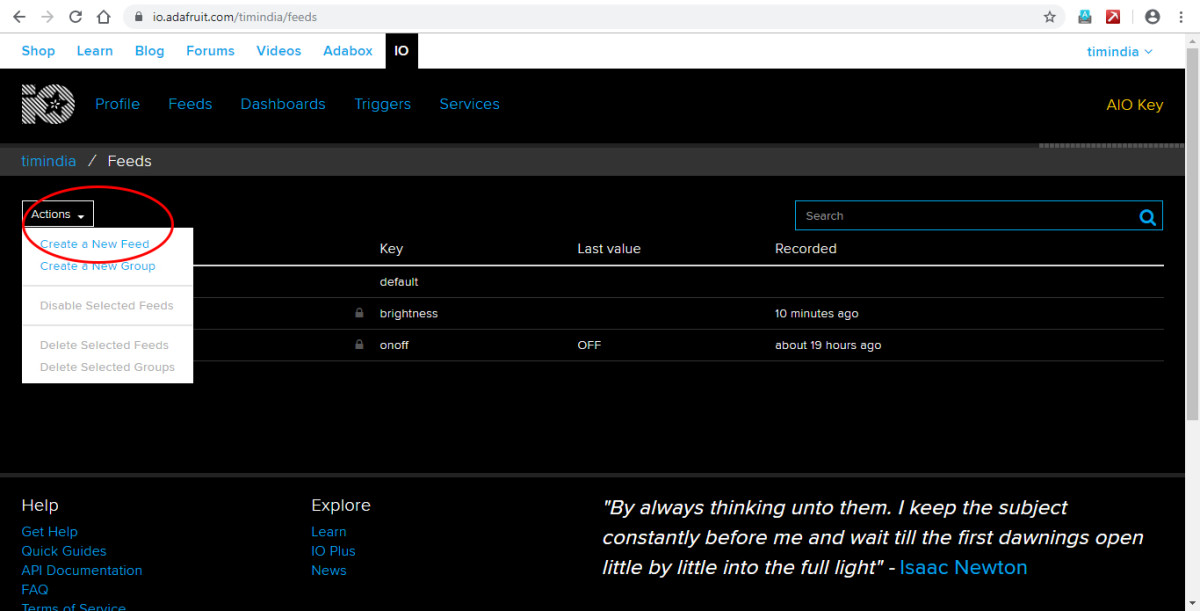
Now, click on Actions->Create a New Feed as shown below.
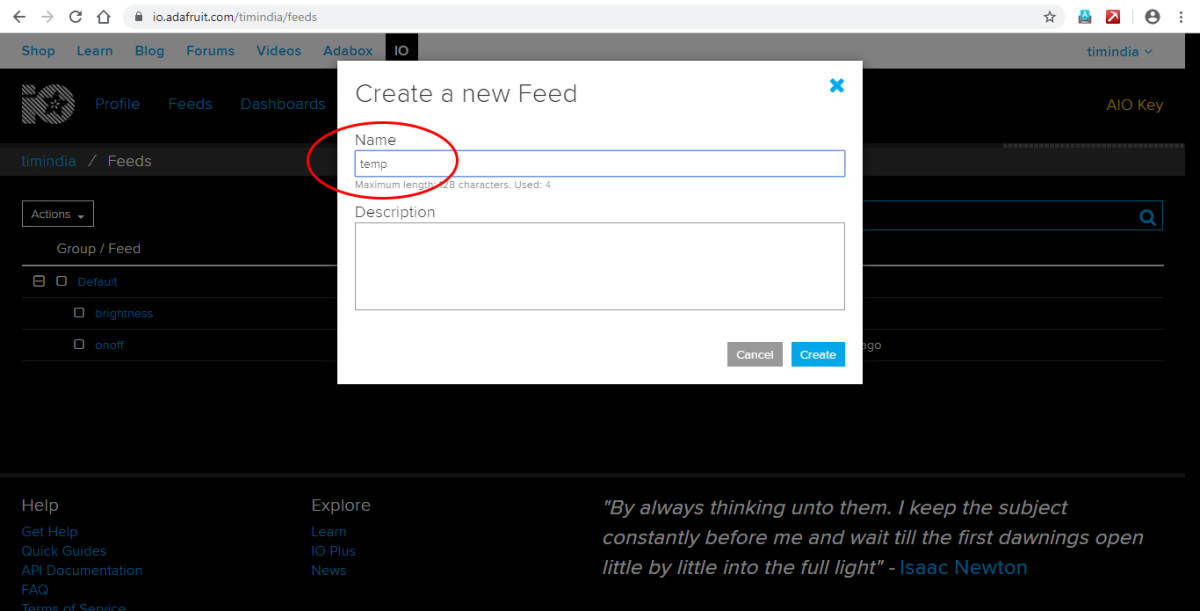
You will see the Create New Feed dialog box as shown in the following figure. Name the feed as ’temp'.
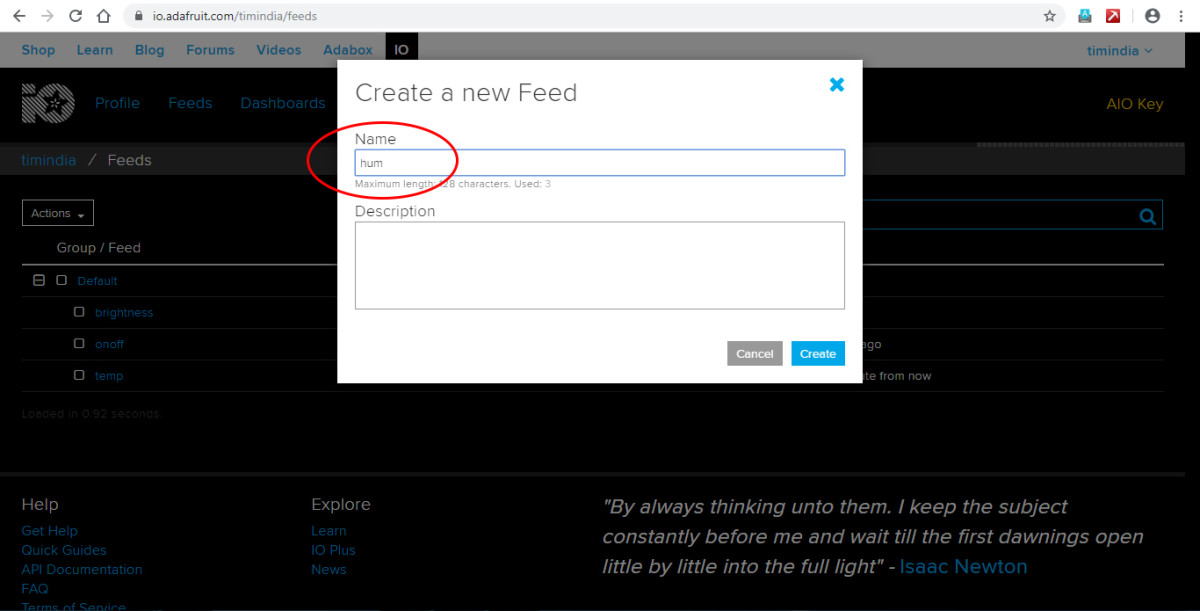
Repeat the action and create another feed ‘hum’ as shown below.
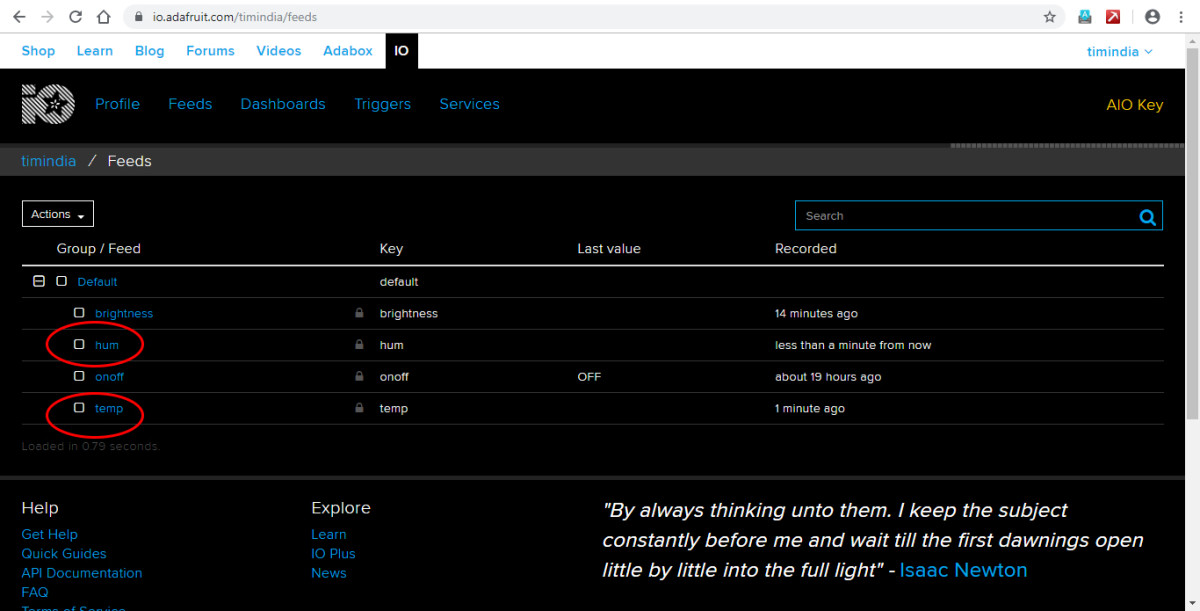
Now you will have two feeds ’temp’ and ‘hum’ to store temperature and humidity data as shown below.
Now navigate to Dashboard->AIO_Controller.
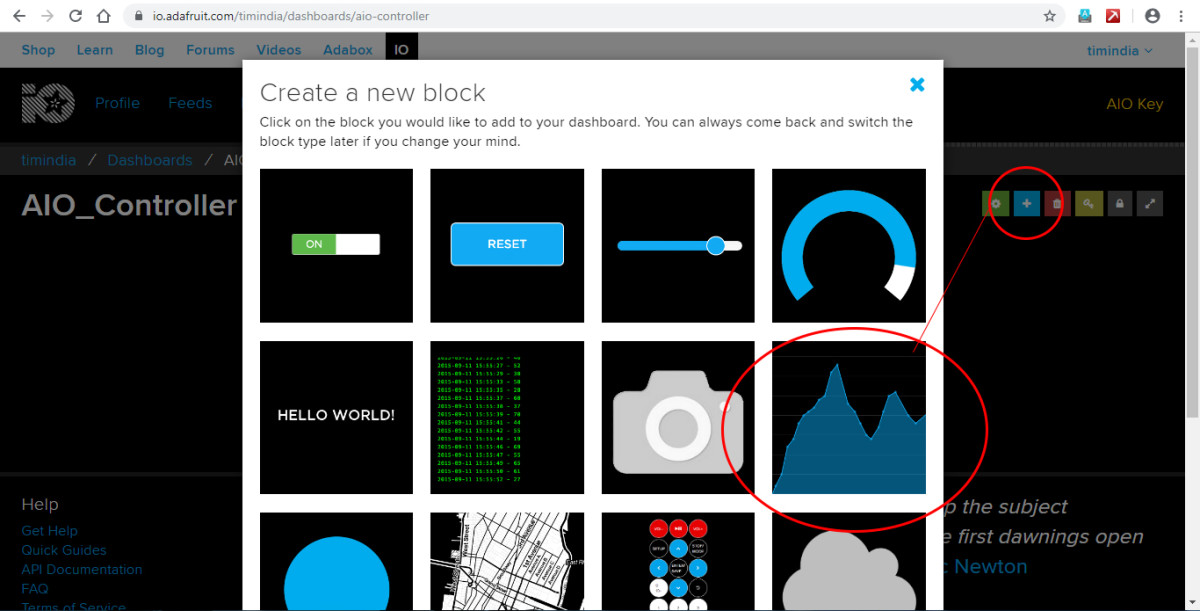
And click the ‘+’ button to add a new block (i.e. Line Chart UI) as shown in the following image.
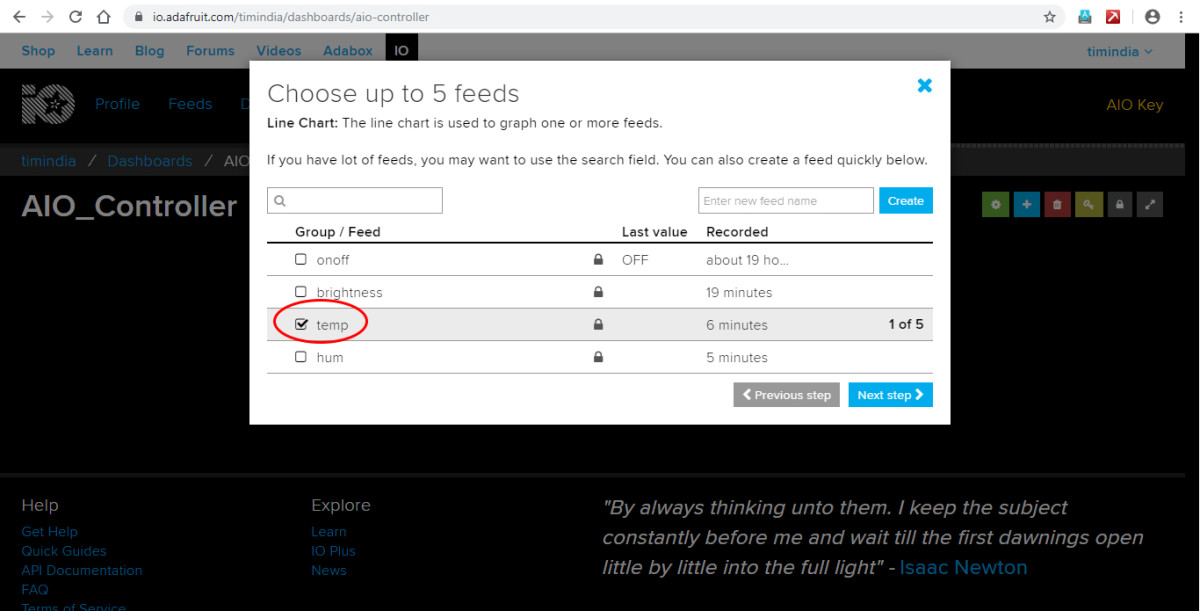
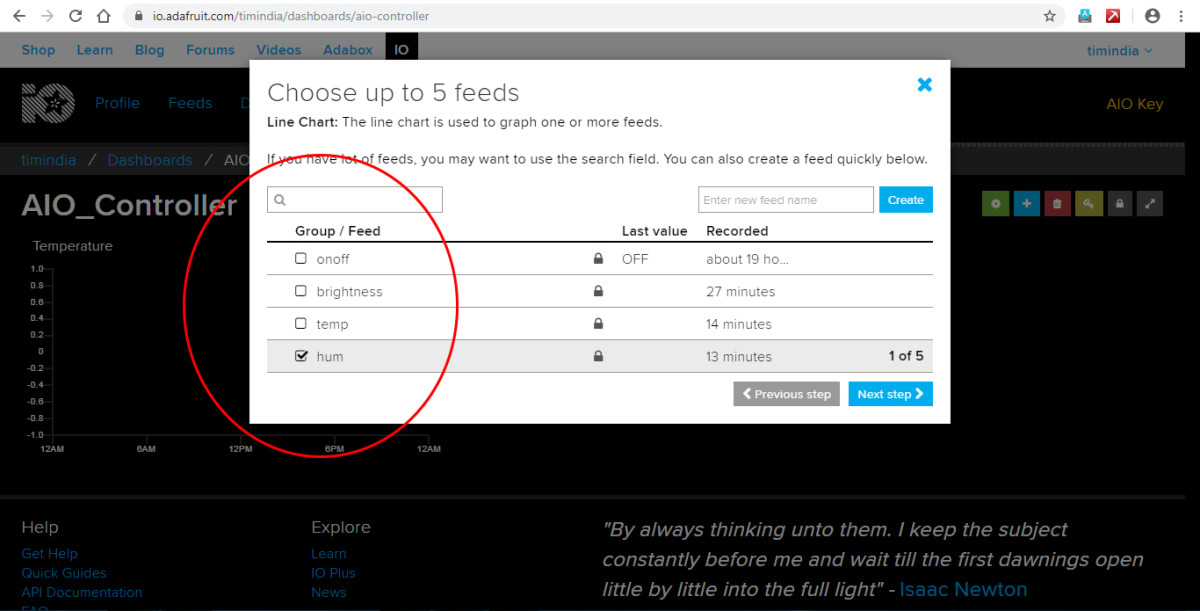
Click on Line Chart UI and select the ’temp’ feed from the list of feeds in the dialog box.
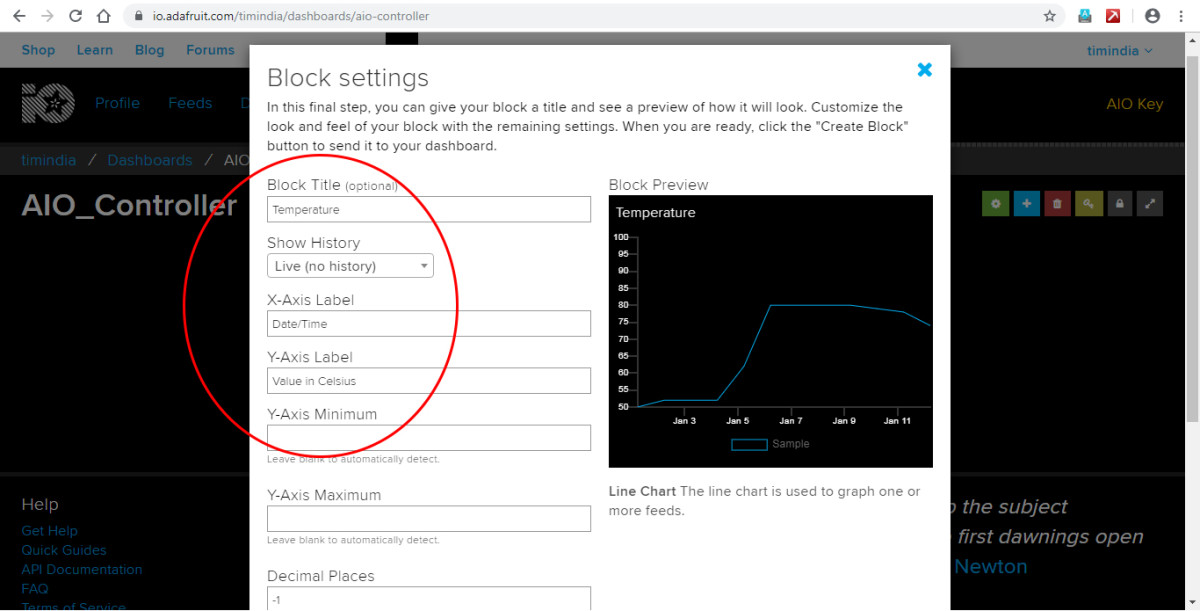
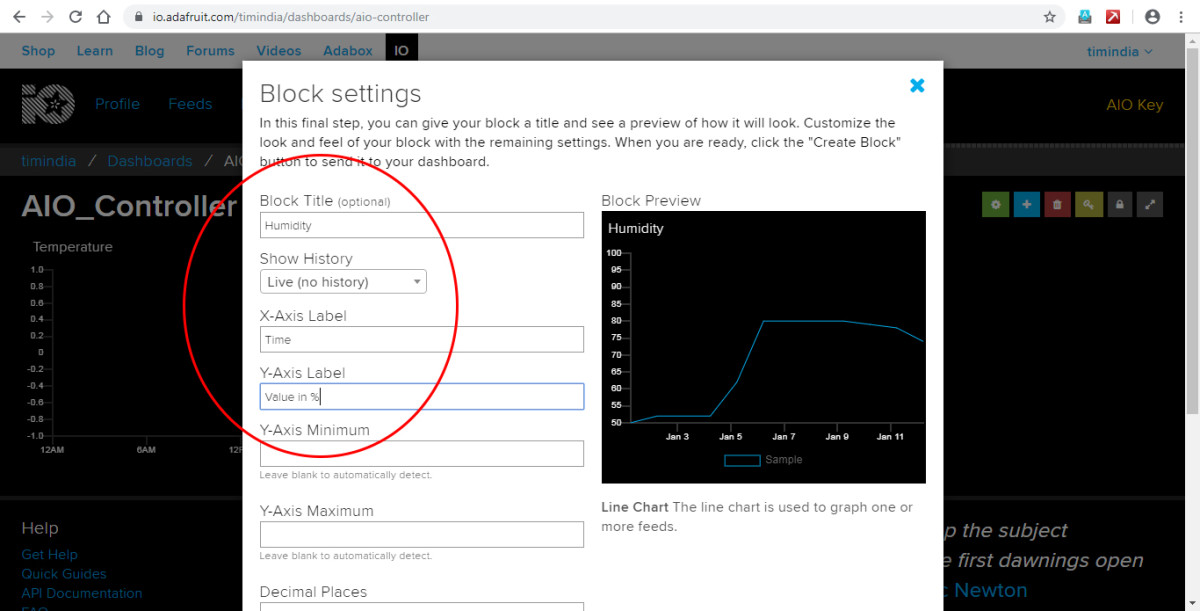
Click Next and specify block settings.
Similarly, add another Line Chart block by selecting ‘hum’ feed as shown in the following two images.
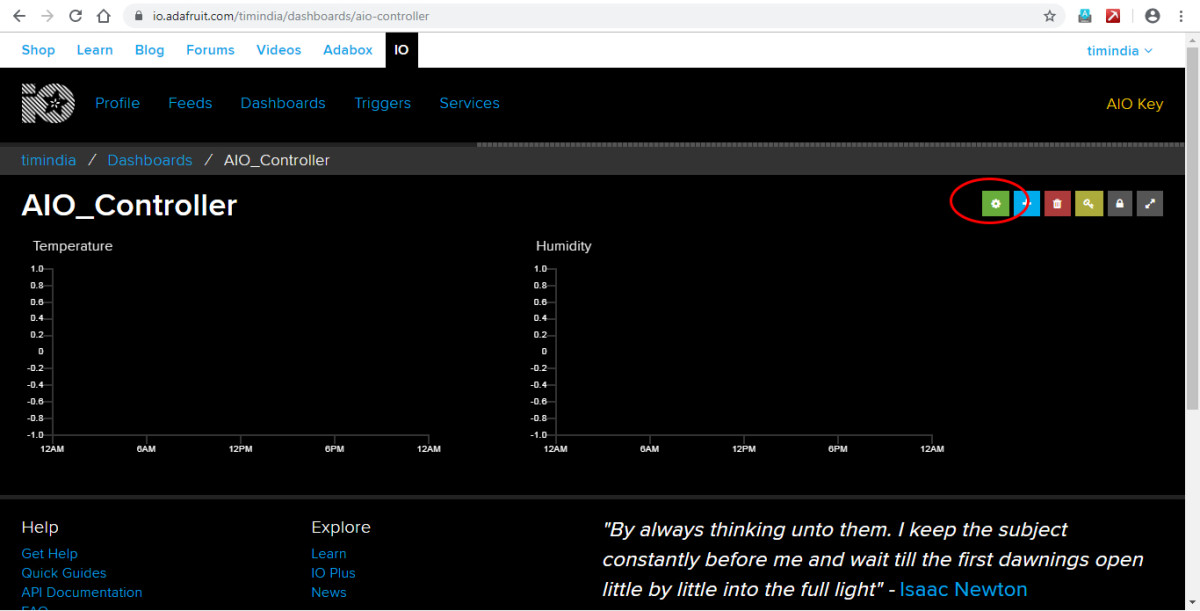
You will now see a dashboard with two line chart blocks.
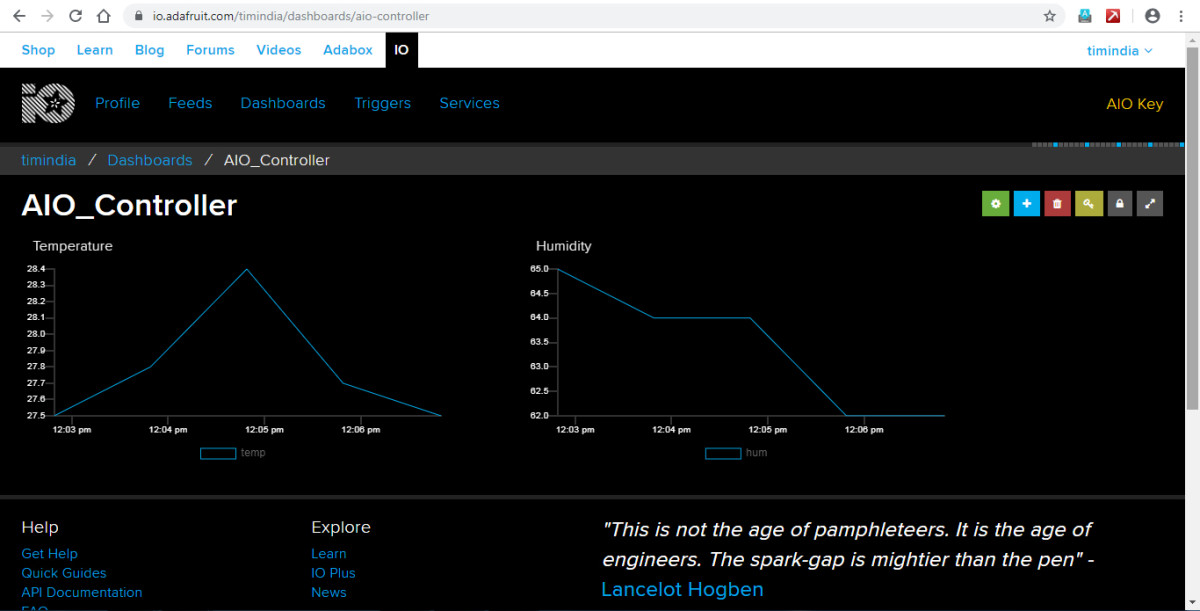
Now connect your device and you will see temperature and humidity values published on the UI.
This content is accurate and true to the best of the author’s knowledge and is not meant to substitute for formal and individualized advice from a qualified professional.