You can create your own personalised Report by starting a “Blank Report”. You can also use a template provided by Google Data Studio that are ready to use immediately. Google Data Studio has easy Data Connectors to your data. Once you have connected to the Data Set, you can immediately start to chart your own Report.
Date Range Filter
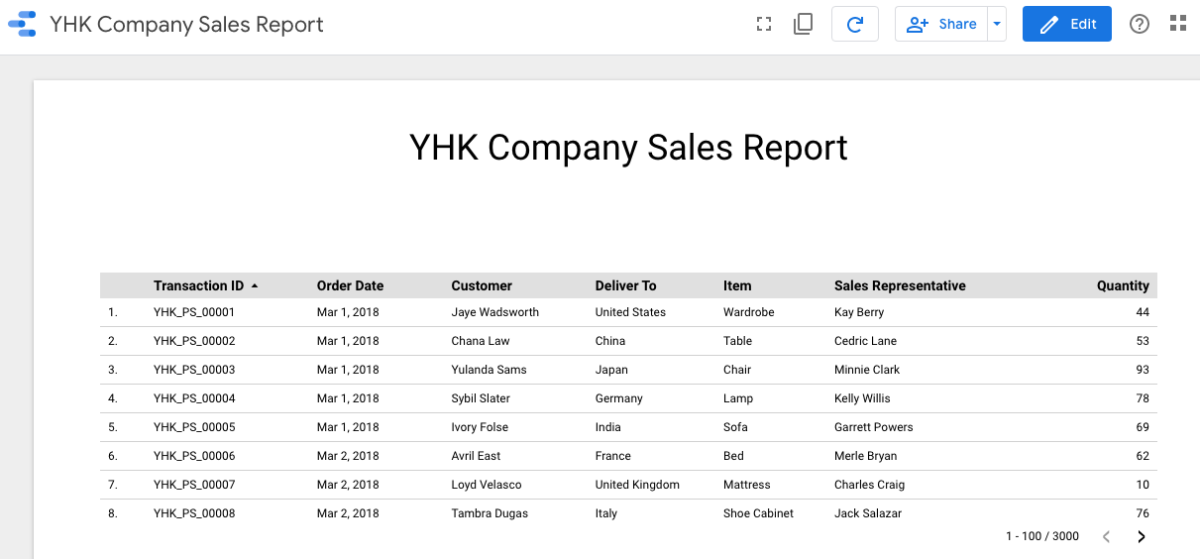
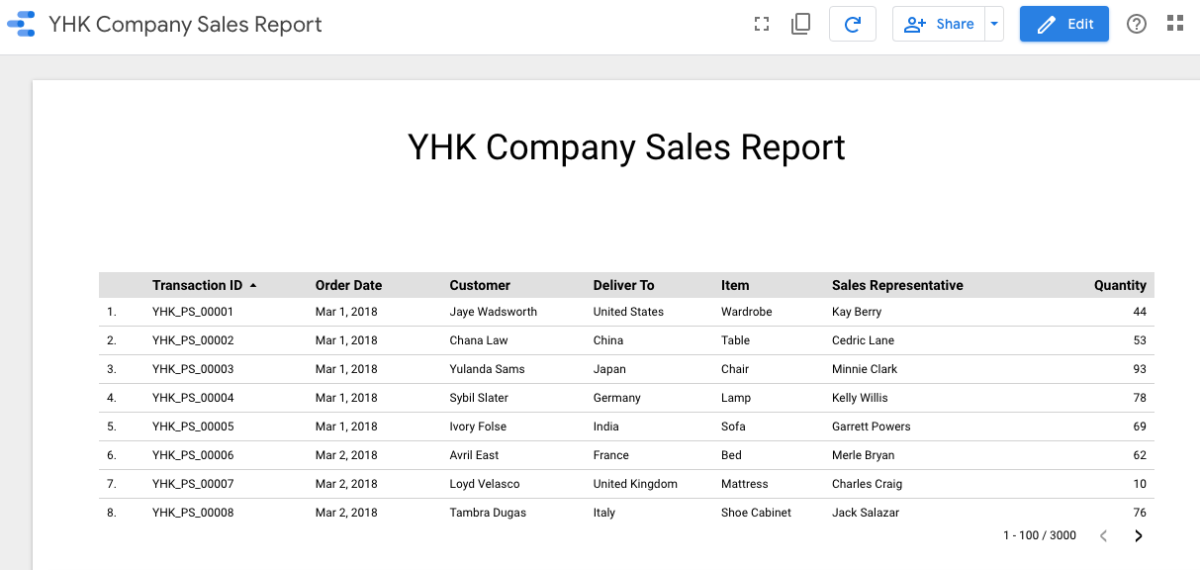
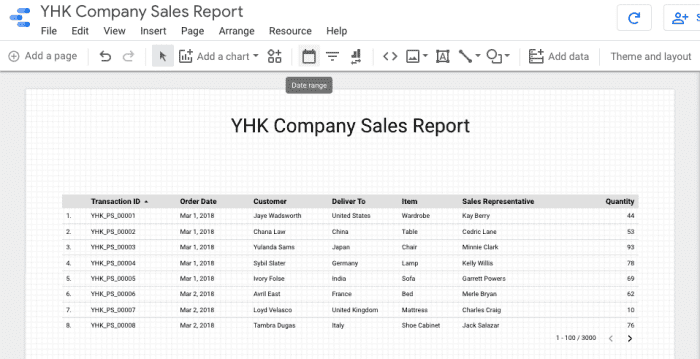
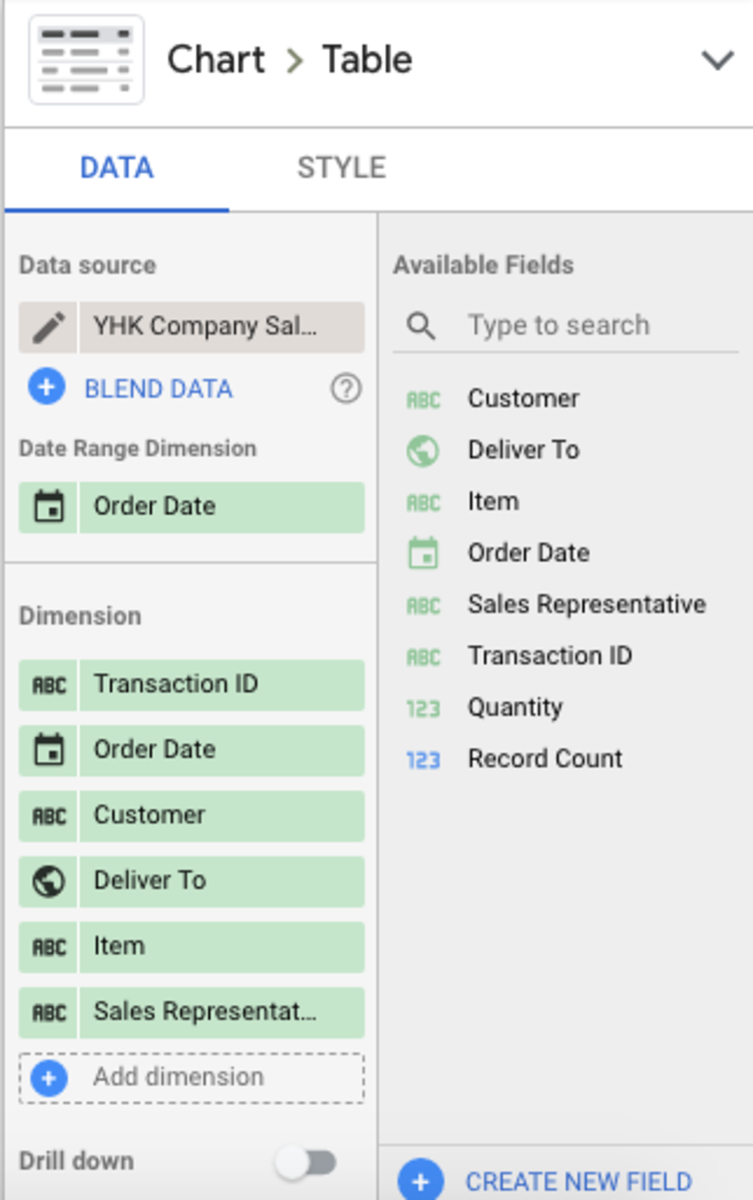
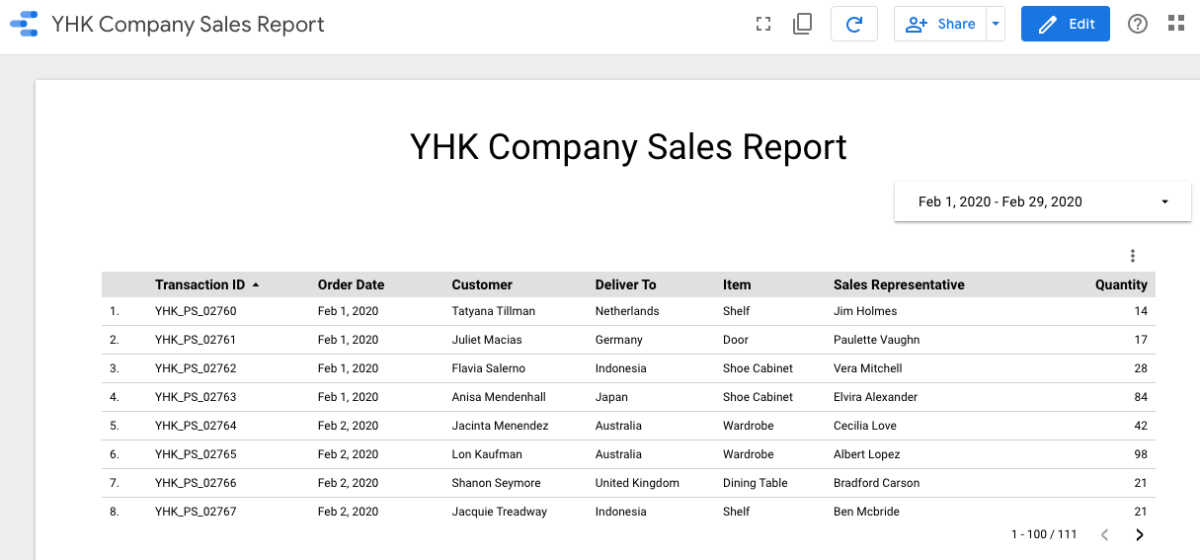
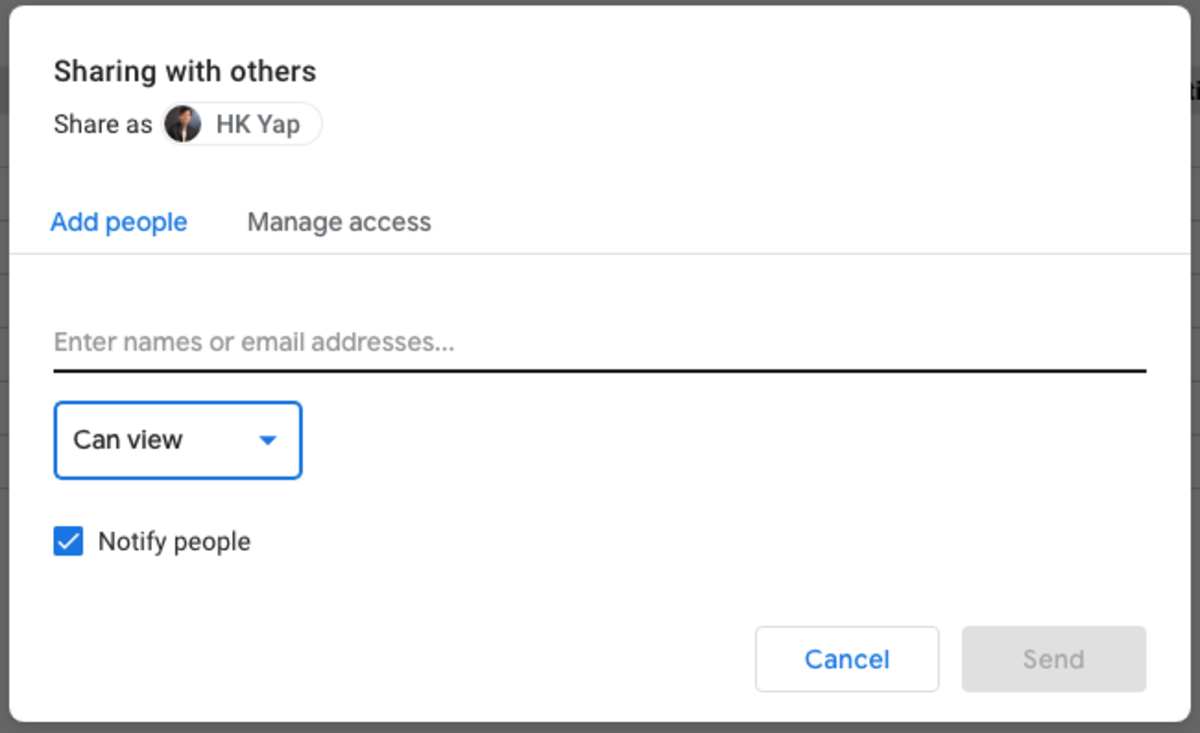
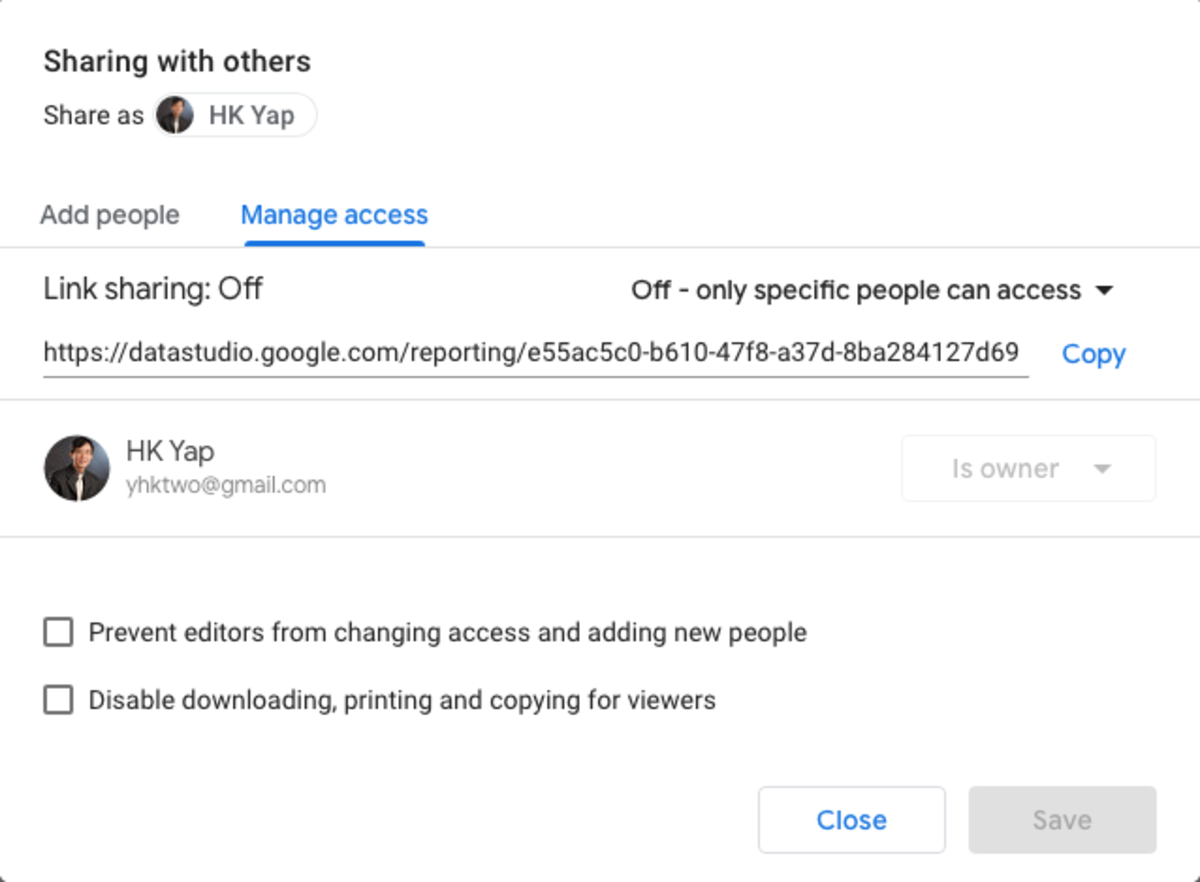
What you have created so far is just a static representation of your Sales Data from Google Sheets. You can have the same dashboard connected with multiple data sources. Every chart you add to your report can be independently connected with its own data source. View mode displays your report in a non-editable form and lets you preview your report as others which you have shared with. Edit mode gives you access to the report editor, which lets you add and remove charts and components in your Report. In Google Data Studio, you can let viewers of your Report know how sales are performing over a certain time period. This can be achieved by adding a Date Range filter. Once added, it will be possible to change the data range you want to visualise for the analysis. You will notice that the “Last Month” Date Range is being applied correctly. However, the data remains the same. There are still 3000 records showing. In order for the Date Range filter to change the way the sales data is shown, you need to do one thing. Make sure you are in “Edit” mode. Click on the Table chart you have added to the Report. Under “Date Range Dimension” on the right, drag “Order Date” to it. This will tell Google Data Studio that this Table will be updated. By default, Google Data Studio applies the filter to every element on your page. Go to View mode one more time. Click on the Date Range dropdown and select “Last Month”. This time, you should see the Table being updated and showing only 111 records. That means, only transactions which occur during “Last Month” will appear here. Now share your Report with your friends. Add them as Editors or View only. The Share interface is very similar to Google collaboration tools such as Google Doc and Google Slides. I shall not explain it here, I’ll leave it to you to explore.
What’s Next
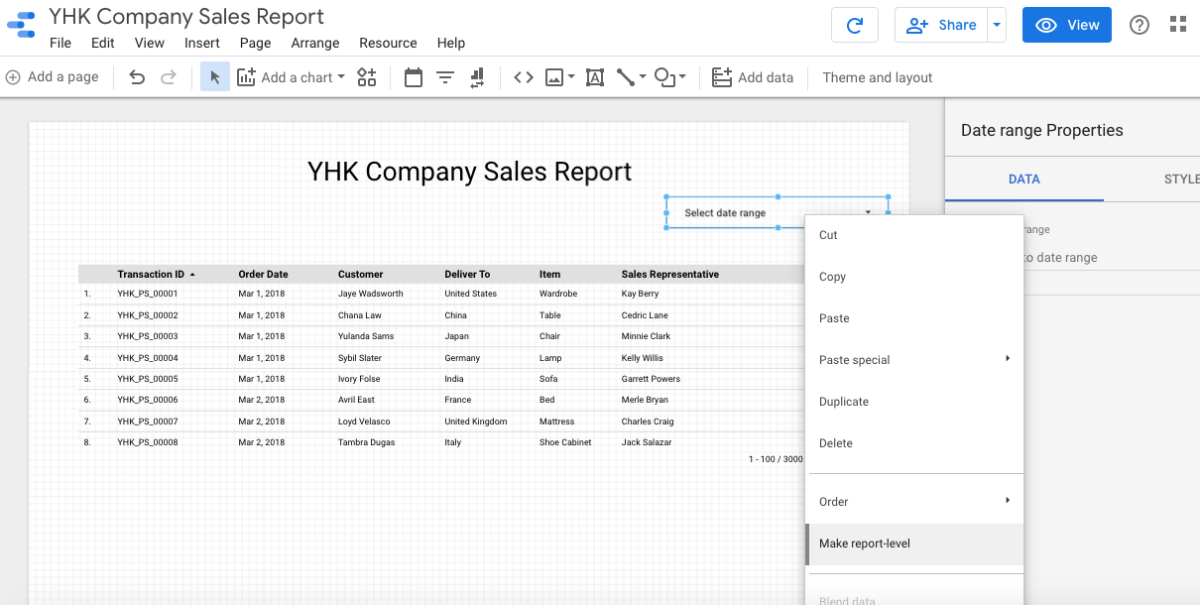
We will be adding more interactions to your Report in the next article. Before you leave this article, make sure you configure the Date Range filter to be Report-level if you want it to appear on every page of this Report.
Navigation
Learn How to Use Google Data Studio to Visualise Data Easily Google Data Studio - Getting Started Data Connectors - Connect To Google Sheets Your First Visualisation Report using Google Data Studio Richer Interactive in Google Data Studio About Filter Control In Google Data Studio Using Charts as Interactive Filters in Google Data Studio Managing Data Sources in Google Data Studio This content is accurate and true to the best of the author’s knowledge and is not meant to substitute for formal and individualized advice from a qualified professional. © 2020 Heng Kiong Yap