Sysstat Utilities
The sysstat package provides a number of utilities for collecting the system use activities and system performance.
iostat – Used for CPU statistics and input/output statistics for the block devices and partitions and generate report. mpstat – Used for processor related statistics and reports. pidstat – Used for I/O, CPU, memory statistics for Linux processes and generate report. tapestat – Used for the statistics for tape drives attached to Linux system. cifsiostat – Used for generating reports CIFS statistics. sar – Used for collects and saves all the system activities and report.
Install Sysstat on Linux
You can opt one of the below method to install Sysstat on your system. The package manager may have older version, so you can try with the source installation.
1. Install with Package Manager
Sysstat package is available in default package repositories, You can install using the following commands. But the default repositories have older version of packages. So we recommend to use installation with source in next step. If you still want to use package manager just run below commands. Let’s enable the sysstat monitoring. Edit the following file and set ENABLED=“true” and save it. After that enable the service and start it.
2. Install from Source
Download the latest stable version from its official website. I always recommend to use stable version on production servers. For development systems you can try with current development version. Here are the commands to download current stable release 11.6.2 and install on your system. Using this method all the binary files are installed under /usr/local/bin directory and the library files are installed under /usr/local/lib directory. Now edit sysstat configuration file and adjust settings. Set the ENABLED=“true” in above file and save it.
View Current CPU Usage
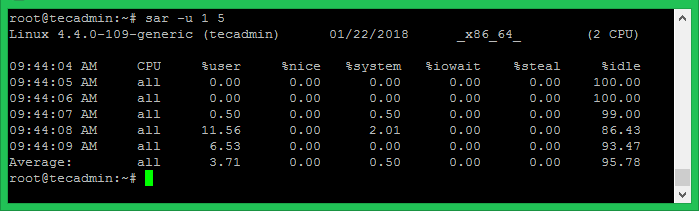
Use sar command with -u option to view CPU statics of current date. You can also view the real-time CPU uses by specifying the time interval and number of times to show data. For example, to view real-time CPU uses for 5 times with the difference of 1 second.
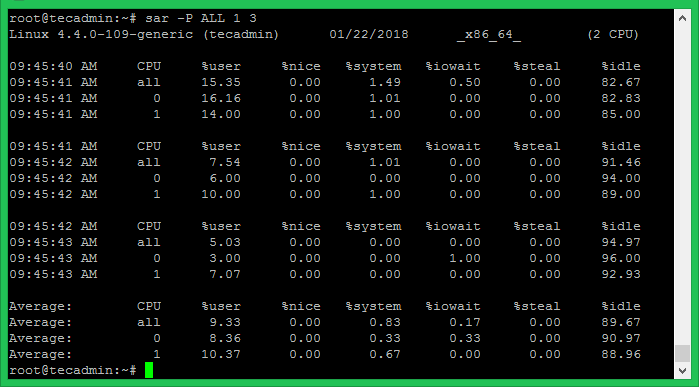
You can view the CPU utilization data in more depth. Nowadays most of the CPU’s are multi-core. To view utilization details of each core individually use -P ALL command.
View Device Usage
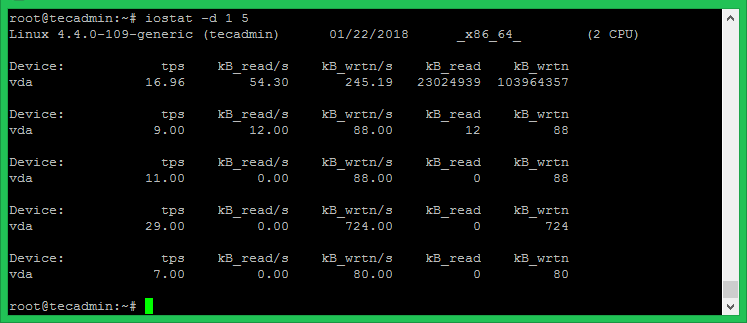
Use the iostat command to find disk statics. It shows the current data transfer per second, the total number of blocks read and write to disk and an average block per seconds.
Details:
tps – Transfers per second. Blk_read/s – Total amount of data read in blocks per second. Blk_wrtn/s – Total amount of data written in blocks per second. Blk_read – Total blocks read. Blk_wrtn – Total blocks written.
You can view more extended I/O statics of disk using the following command.
View Running Process Resource Utilization
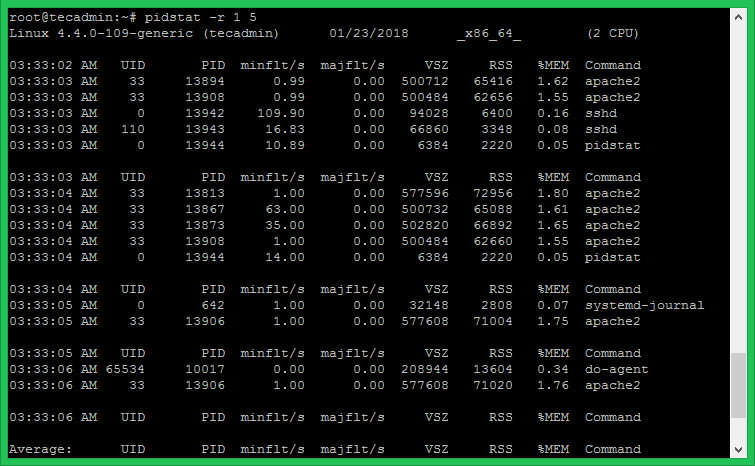
Using pidstat command with switch -d provides you details of currently running processes on systems. Also try pidstat with -r to show resource utilization by processes on every 1 second for the 5 times.
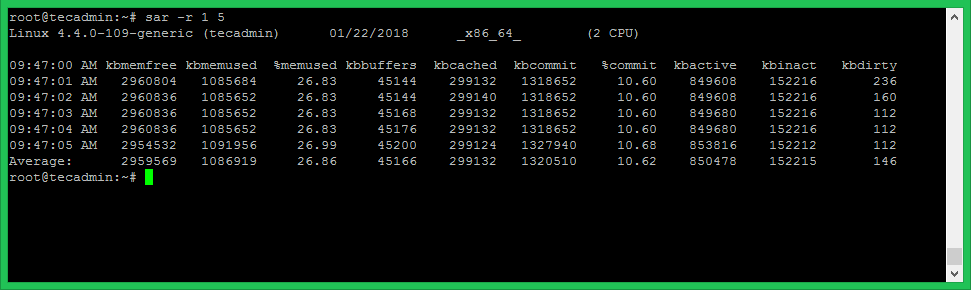
Memory Utilization Data
Use sar command with -r to view the current memory utilization details for the 5 times on every 1 second.