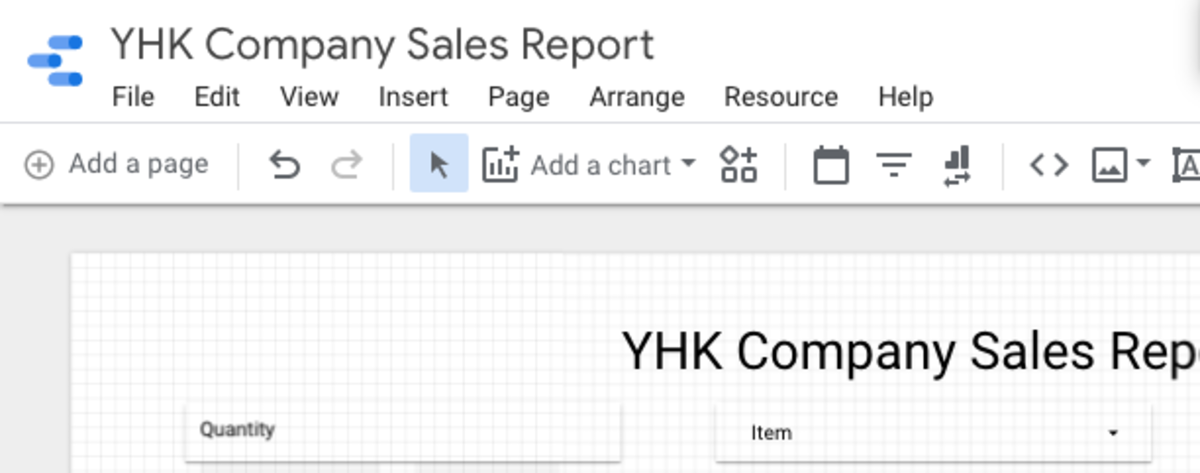
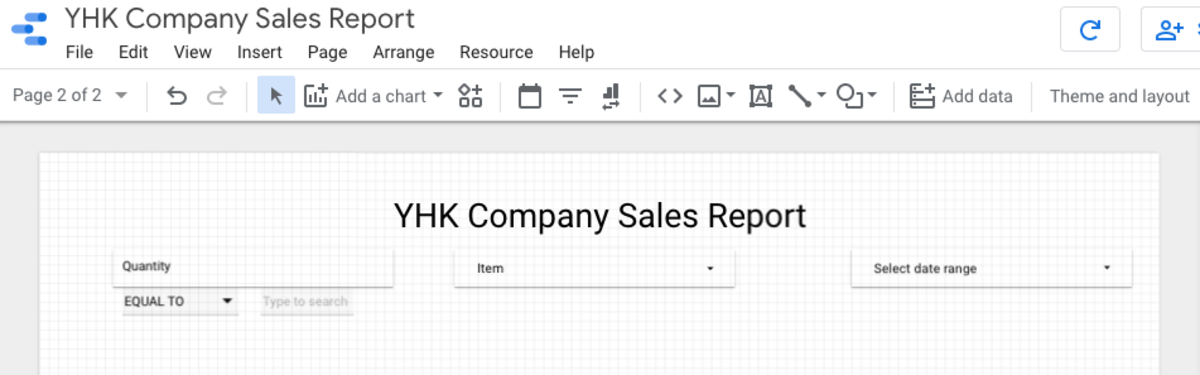
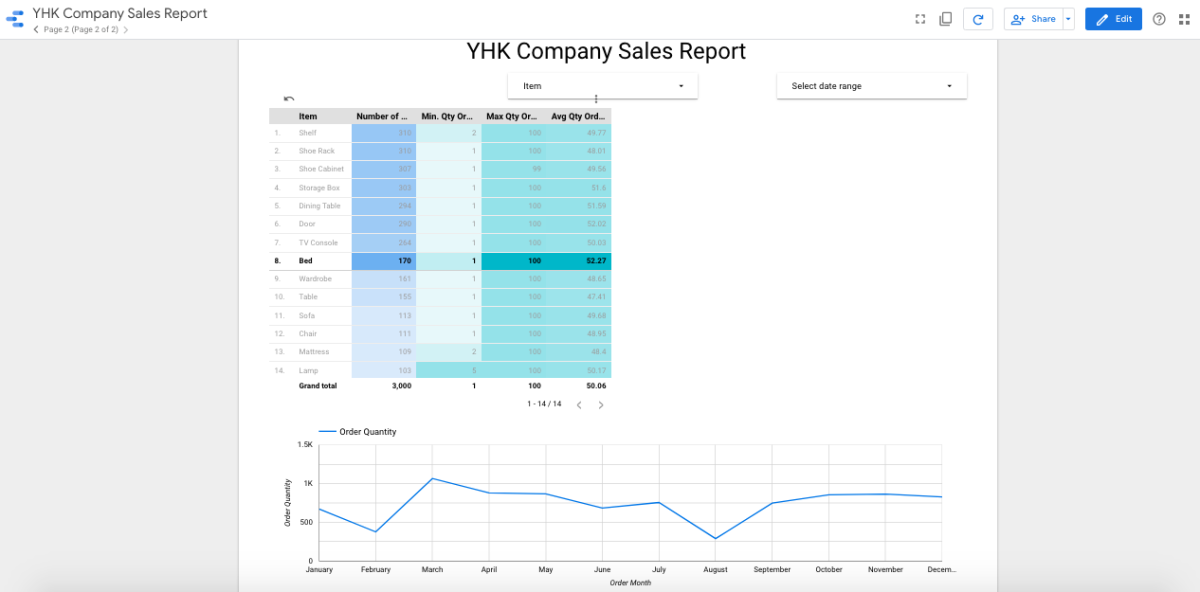
Add a Page as shown in the illustration above. If you had configured the previous three Filter Controls to be “Report Level”, they should also appear on this new Page as seen below.
Adding a Time Series Chart
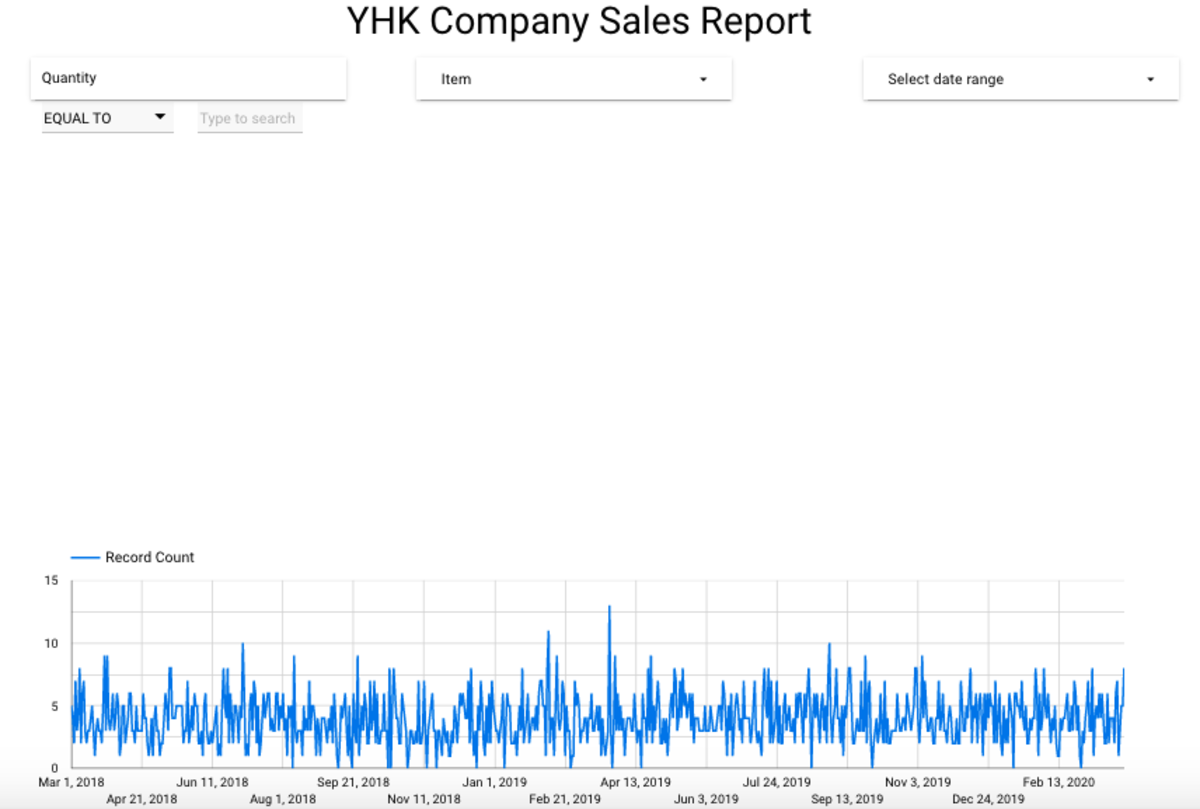
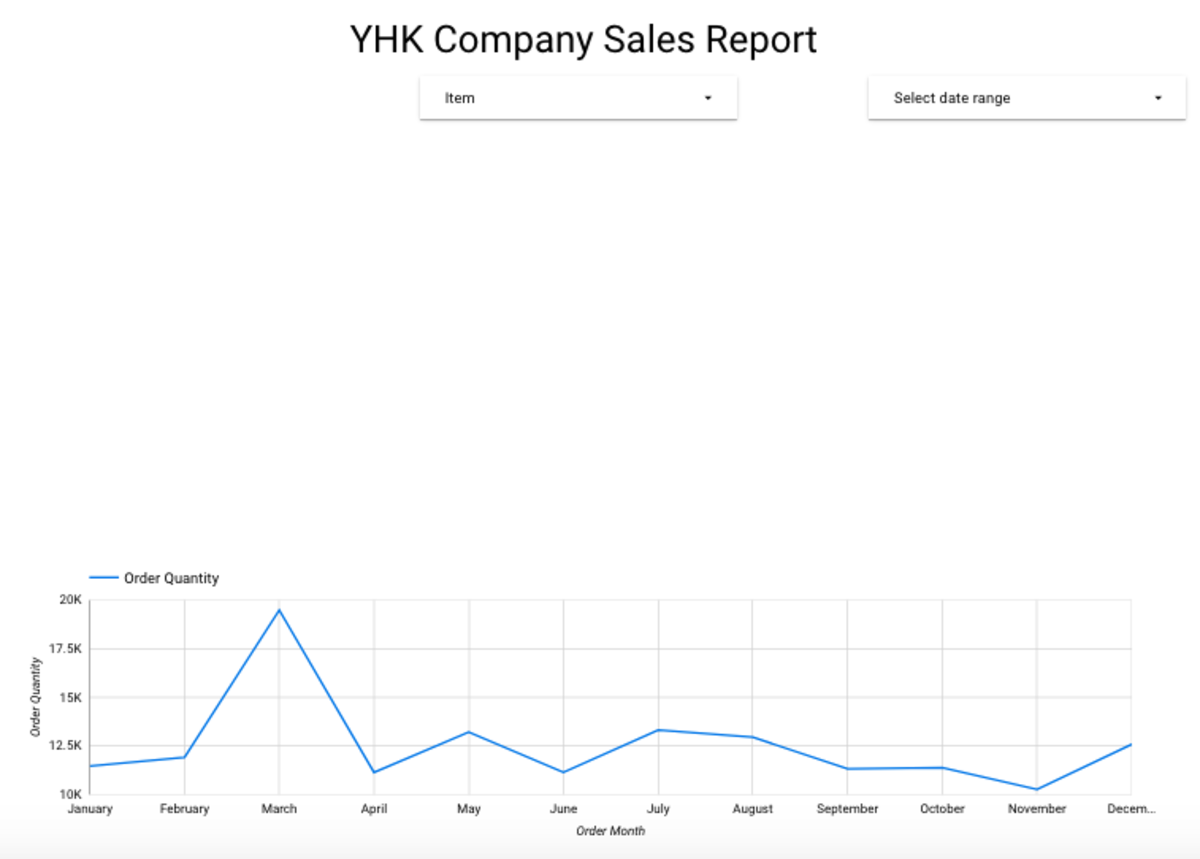
Add a Time Series Chart towards the bottom of Page 2 as shown below. We want to look at the Total Quantities sold per month. Remove the first filter control “Quantity”. Click on the new Time Series Chart and configure as follows:
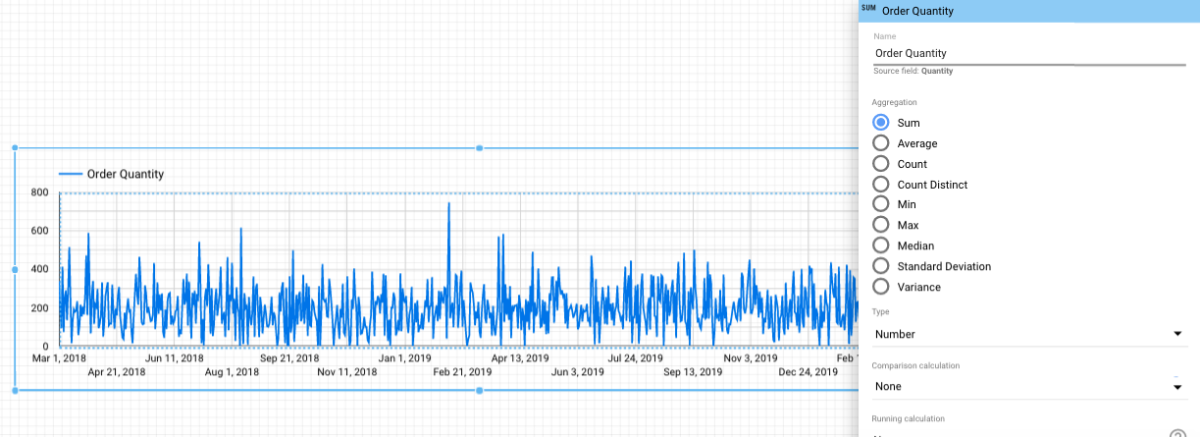
Dimension: Order Date Metric: Quantity (Change Name to Order Quantity)
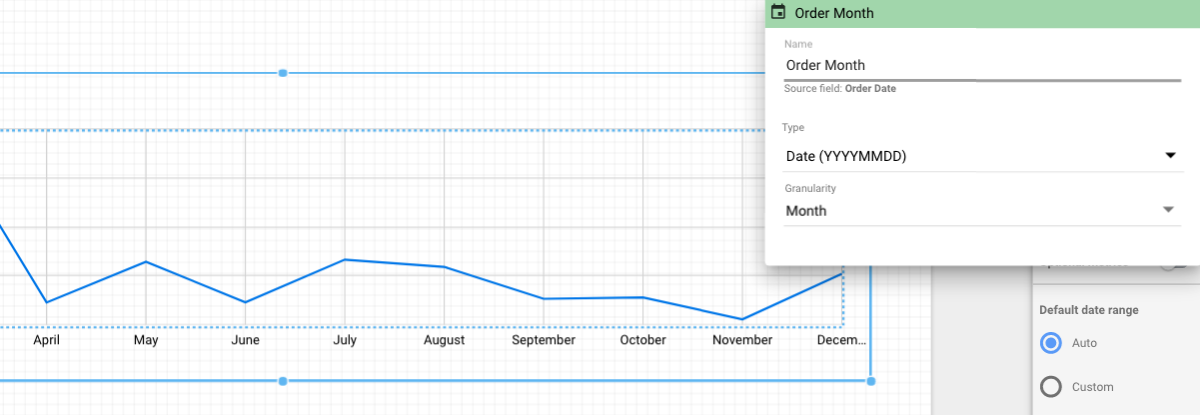
Next, we change the granularity of the X-axis (Time) from Day to Month. Click on the Pencil icon at “Order Date” under Dimension. Rename it to “Order Month”. Check “Show Axis Title” for both Y- and X-axis. You should be getting a Report that looks like this.
Turning Table Charts Into An Interactive Filter
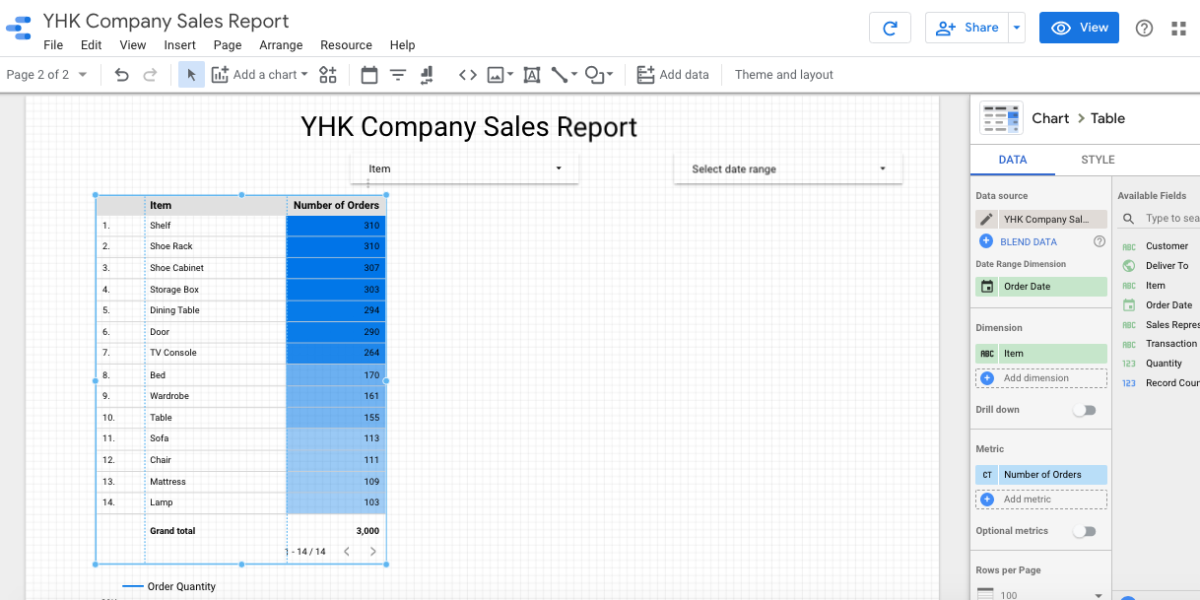
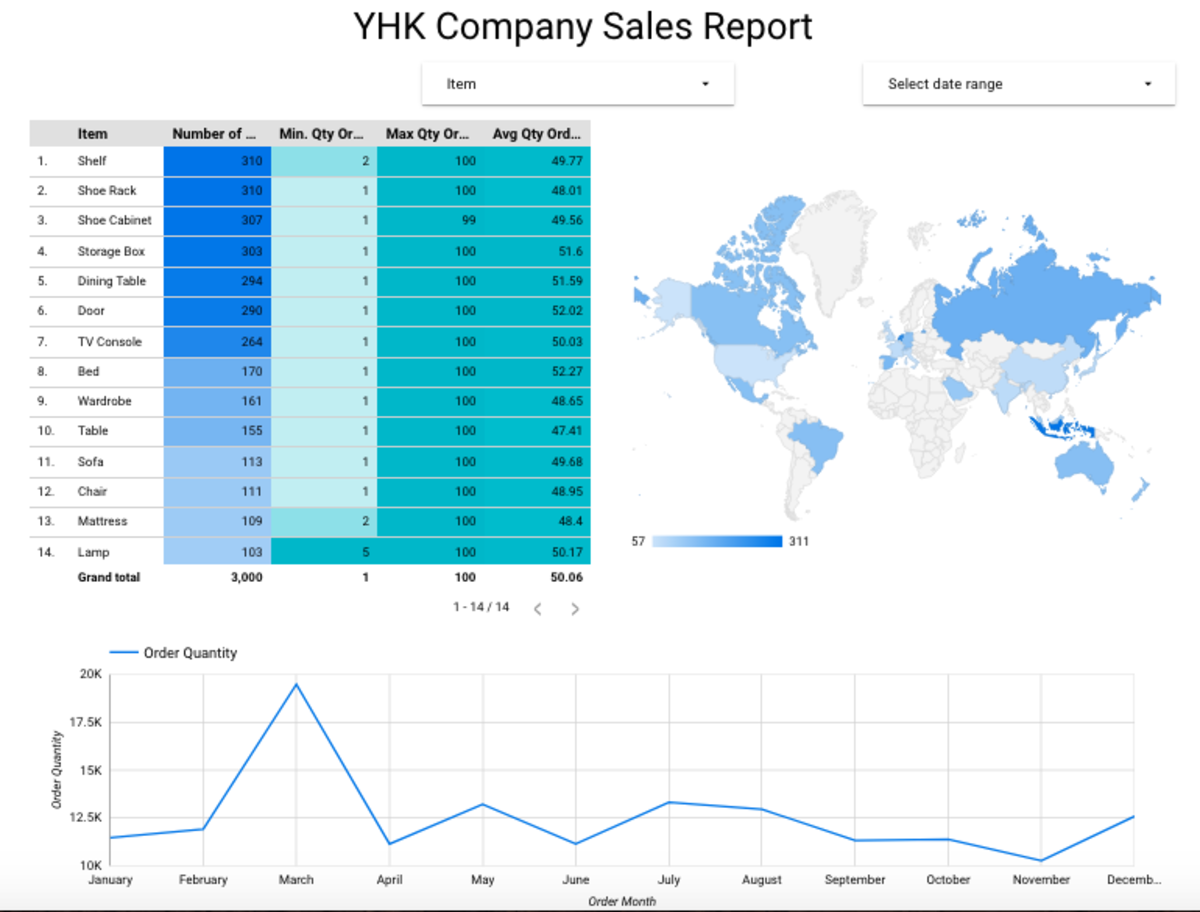
We are going to add now a 2nd chart and turn this chart into a filter. Insert a Table with Heatmap Chart to the Canva, just above the Time Series Chart.
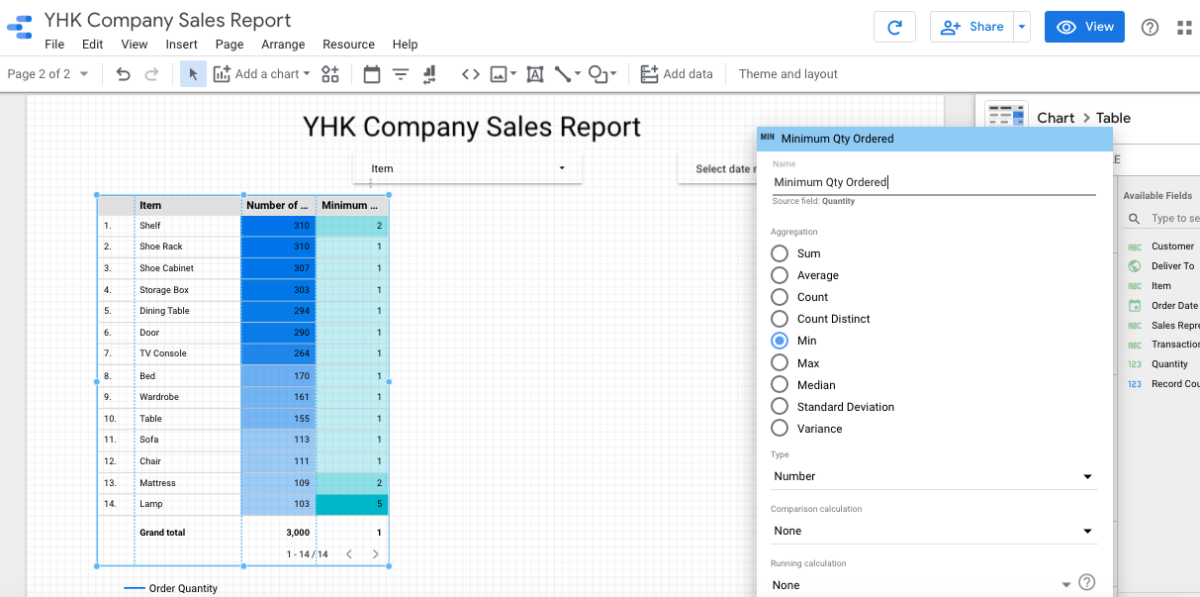
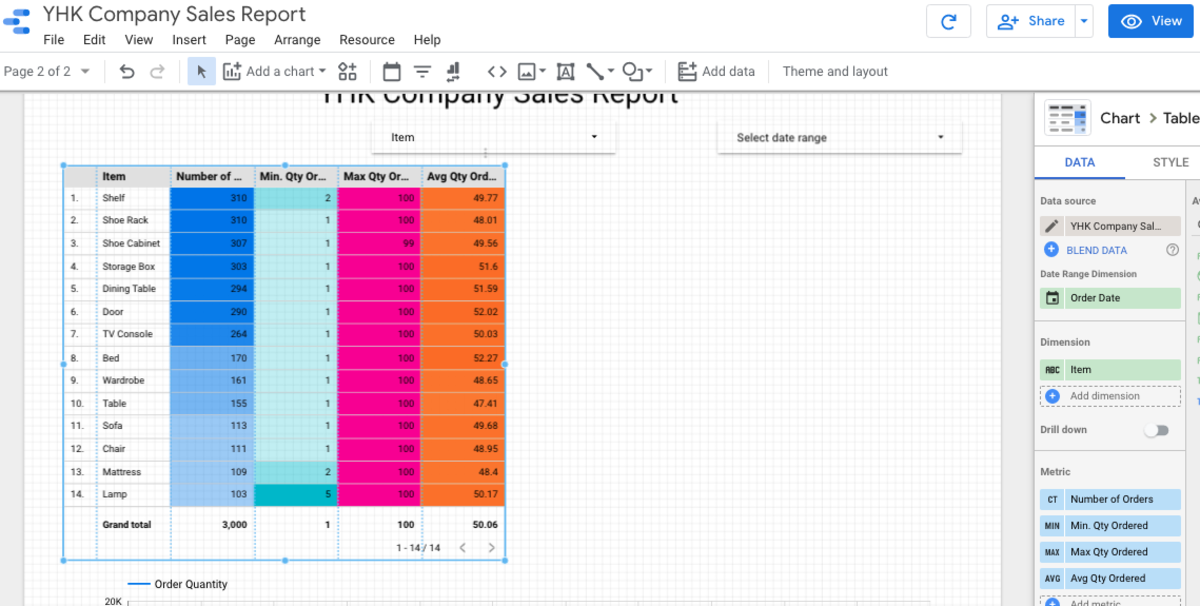
Dimension: Item Metric: Transaction ID (Change name to Number of Orders)
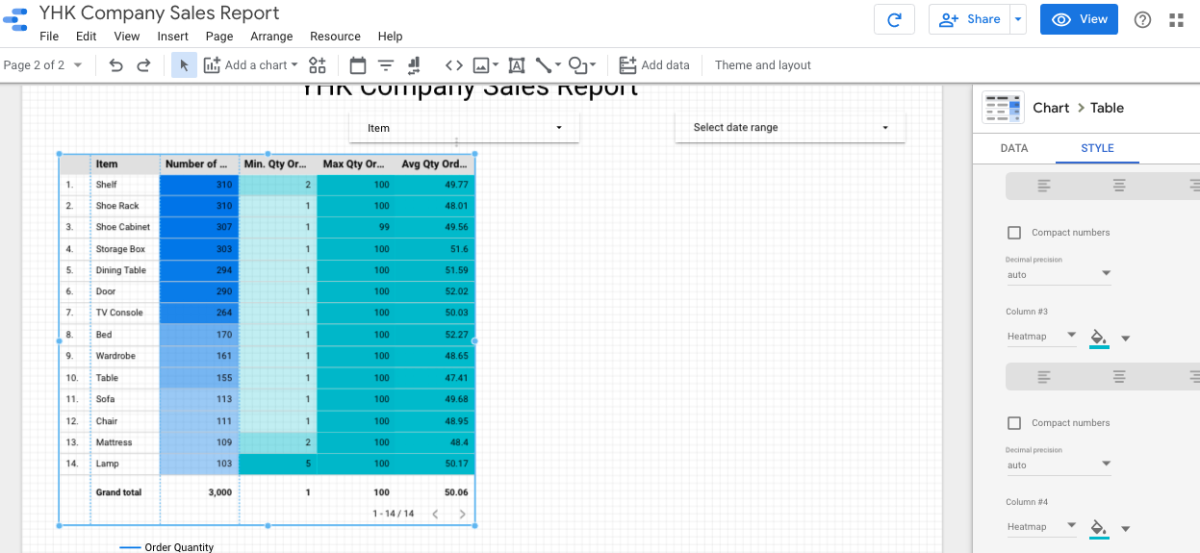
Check “Show Summary Row”. The total number of orders should add up to 3000. Next, we want to see the Max. Min. and Average Quantity Sold by Items. Choosing Count of Transaction ID becomes the proxy to measuring the number of orders received. Add “Quantity” as the second metric to the Table with Heatmap. Click on the Pencil icon and select “Min”. Rename to Min Qty Ordered. Do the same for the following two metrics I find that the Table with Heatmap is too colourful for me. Let’s make the change here. Look under “Style” and amend the colours.
Adding Interactive to Chart
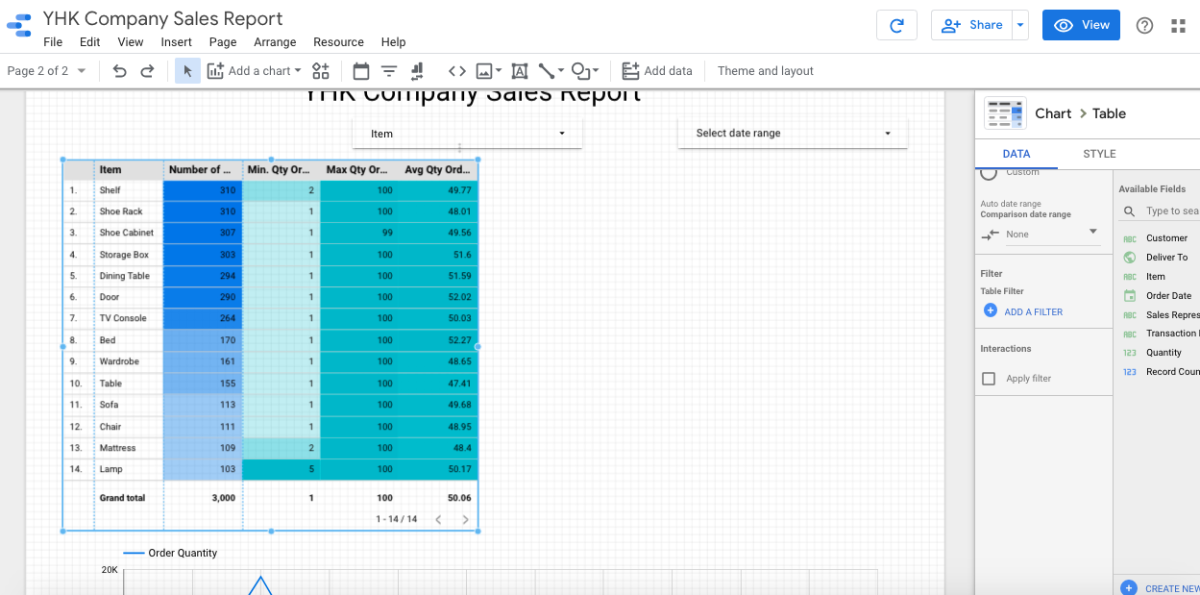
Click on the Table again. This time, under Data, check “Apply Filter” under Interactions. Toggle to View mode. Click “Bed” in the Table chart. See the change being effected at the Time Series Chart below. Play around the various Filter Controls on this Page. Before we leave this article, let us add one more chart which is the Geo Map. You will notice that Google Data Studio automatically added “Deliver To” to the Dimension. Change the Metric to “Transaction ID”. Similarly configure it to show “Count” and rename to “Number of Orders”. Do you remember how to turn this Geo Map into an Interactive Filter? In View mode, click on both this Geo Map and the Table Chart to see the changes to the Time Series Chart.
Navigation
Learn How to Use Google Data Studio to Visualise Data Easily Google Data Studio - Getting Started Data Connectors - Connect To Google Sheets Your First Visualisation Report using Google Data Studio Richer Interactive in Google Data Studio About Filter Control In Google Data Studio Using Charts as Interactive Filters in Google Data Studio Managing Data Sources in Google Data Studio