Canva
A Business Analytics Service
Microsoft Power BI is a service of business analytics that provides interactive, visual insights. It connects to hundreds of data sources, including Azure SQL Database and Azure SQL Data Warehouse, Excel, and CSV/Text files. Power BI can model and shape data on the fly without creating complex reports beforehand. Unrivaled analytics capabilities like natural language Q&A and innovative forecasting models that automatically suggest insights to you in real-time making it easy for anyone at your company to answer questions using their own words or a simple keyword search.
Transform Data Into Stunning Visuals and Share Them
You can share your dashboard with colleagues and invite them to collaborate on it. You can embed your dashboard on a webpage or share the link with mobile devices.
Real-Time Sharing
When you enable sharing for a Power BI report, anyone with whom you have shared access will be able to see the same data in real-time and make changes to the report by using shared editing features. Power BI users should take advantage of this feature because it makes it easy for anyone who has been permitted by an owner of a report or dashboard to make edits without having to download anything locally first. This is especially helpful if they access reports from remote locations such as branch offices or home offices (HOs).
Collaboration
In addition, shared editing can be a powerful tool for companies, especially remote employees, to foster collaboration and make it easier for team members to work together. For example, you could have multiple people working on a Power BI report simultaneously, each making changes as they see fit. Once everyone is done making their changes or additions, you can then merge the changes into one report, which is much easier than having multiple people trying to edit the same report independently. Shared editing isn’t available in every version of Power BI; only those with enterprise licenses have access.
Connect to Hundreds of Data Sources
Microsoft Power BI can connect to hundreds of data sources. It can integrate with data from various sources, including on-premises and cloud-based data stores, Azure services, and third-party APIs. The most common types of connections are:
On-premises SQL Servers Cloud services like Google Sheets or Salesforce Data stored in Azure Blob Storage Dataverse Dataflows
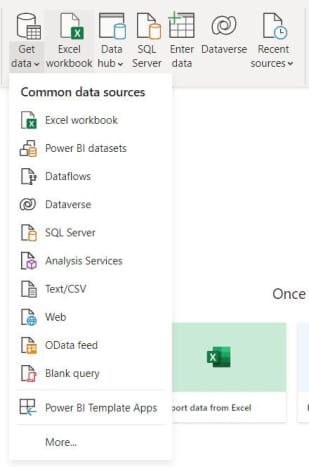
The image below shows the most commonly used data sources in Power BI. You can view these sources by clicking on Get Data button on the toolbar in the Data section. In addition, there are separate buttons on the ribbon for quickly importing data from Excel, SQL server, and dataverse.
Model and Shape Data on the Fly
One of the fantastic things about Microsoft Power BI is that it doesn’t require you to pre-define your data model. Instead, it’s designed so that you can start working with your data for analysis right away.
Detect and Create Relationships
Microsoft Power BI will automatically detect and create relationships between your columns of data. You can then use these relationships as a basis for further analysis and visualizations as needed without having to define them first or run any queries. In addition, there’s no need to pre-define new columns when you want additional information from the same source—you can add them whenever needed.
Unrivaled Analytics
Microsoft Power BI is an Excel add-in that helps you make sense of your data. It can perform various analytics, including:
predictive modeling trend analysis advanced text analytics
With Power BI, you can find trends in your data, make better decisions based on what you’ve learned from the insights it provides and predict future results based on historical information.
Use Complex Machine Learning Algorithms (ML)
Many people consider Microsoft Power BI one of the most powerful tools for data analysis today. This is because it makes it easy for anyone without experience in statistics or mathematics to use complex machine learning algorithms (ML) like linear regression or logistic regression models. This is achieved by using prebuilt templates within their reporting toolbox instead of having to learn anything new about programming languages like R or Python before being able to work with these advanced algorithms themselves through these same types of templates.
Ever-Growing Set of Machine Learning Features
Microsoft Power BI has several machine learning features that make it easier to do data analysis. These include:
Predictions: This feature makes it possible for you to predict future trends based on past data in your report. You can use this feature to identify things that will likely happen next and create scenarios based on these predictions. Recommender Engine: Power BI’s recommender engine uses machine learning algorithms like collaborative or content-based filtering algorithms to recommend the most relevant content to your users. This feature is handy for business intelligence, where you can use it to identify which reports or dashboards apply to specific users based on their past usage. Automated tasks: This includes tasks such as creating a new report from existing reports or creating charts from existing charts or tables, and even automatically adding new rows to a table. The automated tasks feature is beneficial not only for business intelligence but also for customer support. For example, you can set up an automated task to create a new report when a customer makes a new request or ticket in your help desk software. When the new request is created, Power BI automatically creates a report and sends it to the user via email with instructions for viewing the report. User previous queries: User experience is improved by suggesting queries based on previous ones you’ve done. This feature is suitable for both business intelligence and customer support. For example, if you run a query to find the average sale price of all products, Power BI can suggest similar queries based on what other users have been doing. This allows you to quickly learn about new insights available in your data without conducting extensive research.
Real-Time Intelligence and Predictive Analytics
Power BI allows you to analyze data in a way that will enable you to make better decisions faster while also providing insights into how your business is performing today. This can be done by using its predictive analytics capabilities, which automatically detect patterns within your data and predict future trends based on those patterns. For example, suppose you create a dashboard showing sales over time across different regions. In that case, Power BI will identify any anomalies within the data set that doesn’t fit into standard patterns and suggest possible solutions for why these anomalies happened (e.g., an increase in marketing spending one month). This real-time intelligence feature makes it easier for users to gain helpful information about their businesses without having access to or waiting for reports from IT teams who may not even know what questions need answering. This goes beyond just seeing what happened yesterday or last month—it provides insight into how current actions yield results today based on past performances and analyses predictions about what might happen tomorrow, given inputted information about everything from market conditions and weather forecasts up until now.
Conclusion
If you haven’t started using Microsoft Power BI yet, now is the time to start. It’s easy to set up and start using Power BI as they have a great free version that can be used by anyone who wants to try their hand at data analytics without investing in expensive software. I hope this article has helped explain how Microsoft Power BI works and what it can do for you.
10 Best Chrome Extensions for Programmers in 2022Chrome is today’s most popular web browser and is available on various platforms. Usage of chrome extensions can enhance a user experience to a great extent. This article will cover the top ten fantastic chrome extensions for programmers who want to The 11 Most Used Data Science Tools in 2022Data scientists use sophisticated tools and algorithms to find patterns in large datasets to help companies make better business decisions. In this article, we’ll look at some popular data science tools that have gained traction over the last few yea
This content is accurate and true to the best of the author’s knowledge and is not meant to substitute for formal and individualized advice from a qualified professional. © 2022 Hassan