Google Data Studio allows you to automate your Report. Once you have created a dashboard, you can share it with others to self-serve that data, giving them easier access to what they need.
How to Build Your First Report
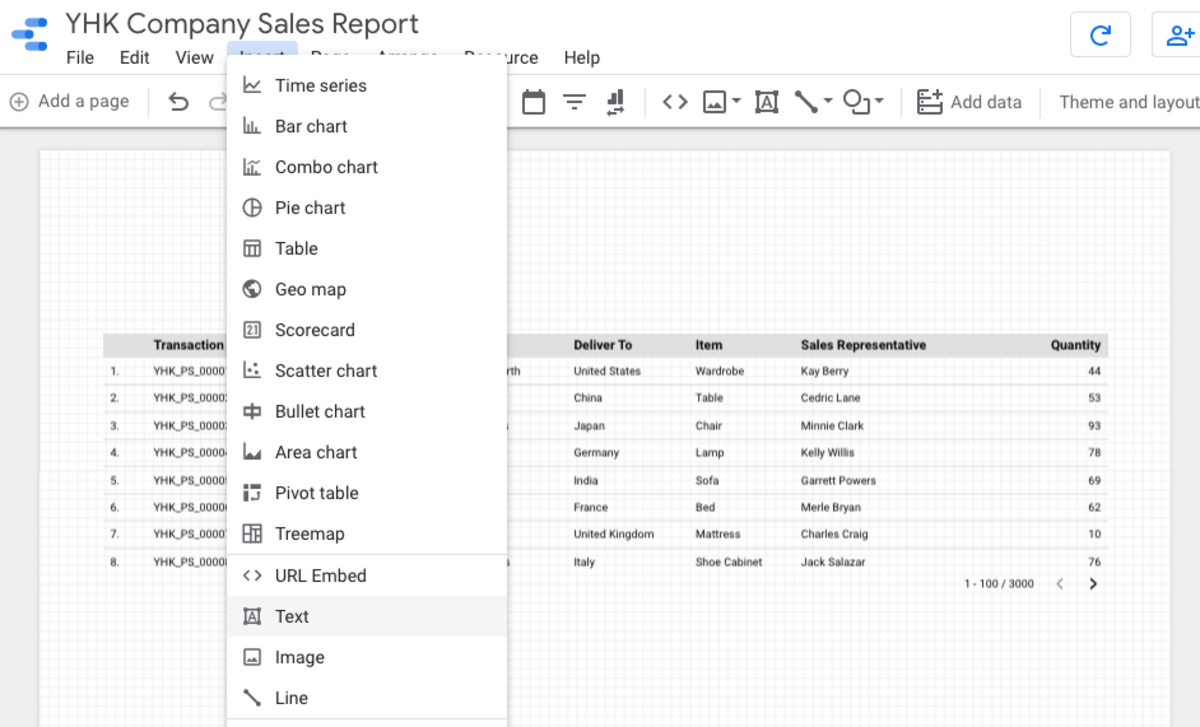
Now that you have linked your data in Google Sheets, it’s time to build your first Report. There are many different types of charts, tables, and scorecards that you can add to your dashboard in Google Data Studio.
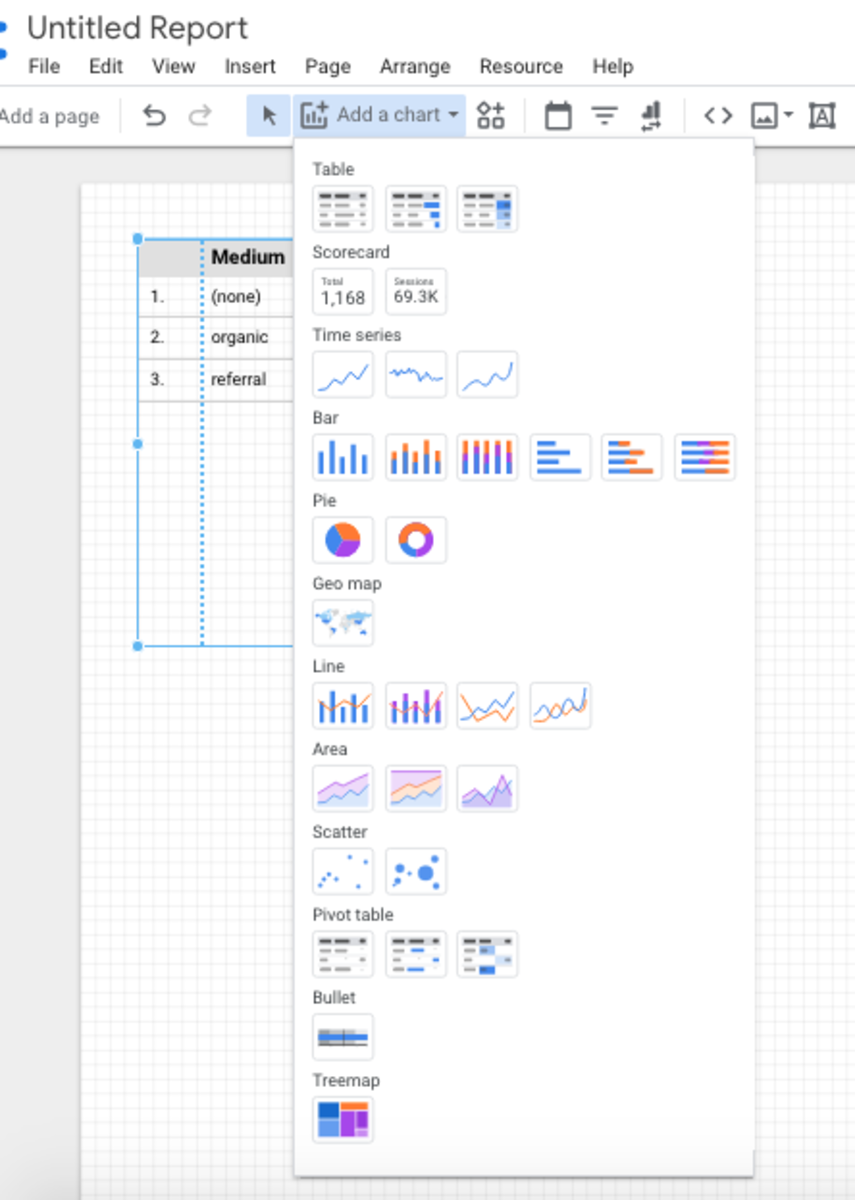
Table Scorecard Time Series Bar Pie Geo Map Line Area Scatter Pivot Table Bullet Treemap
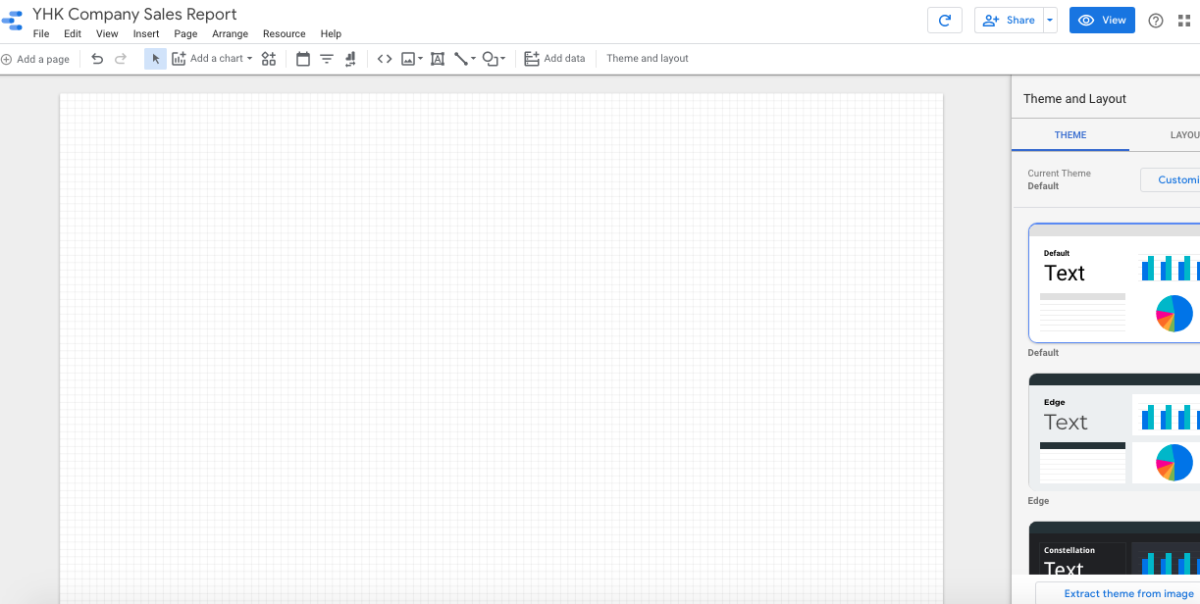
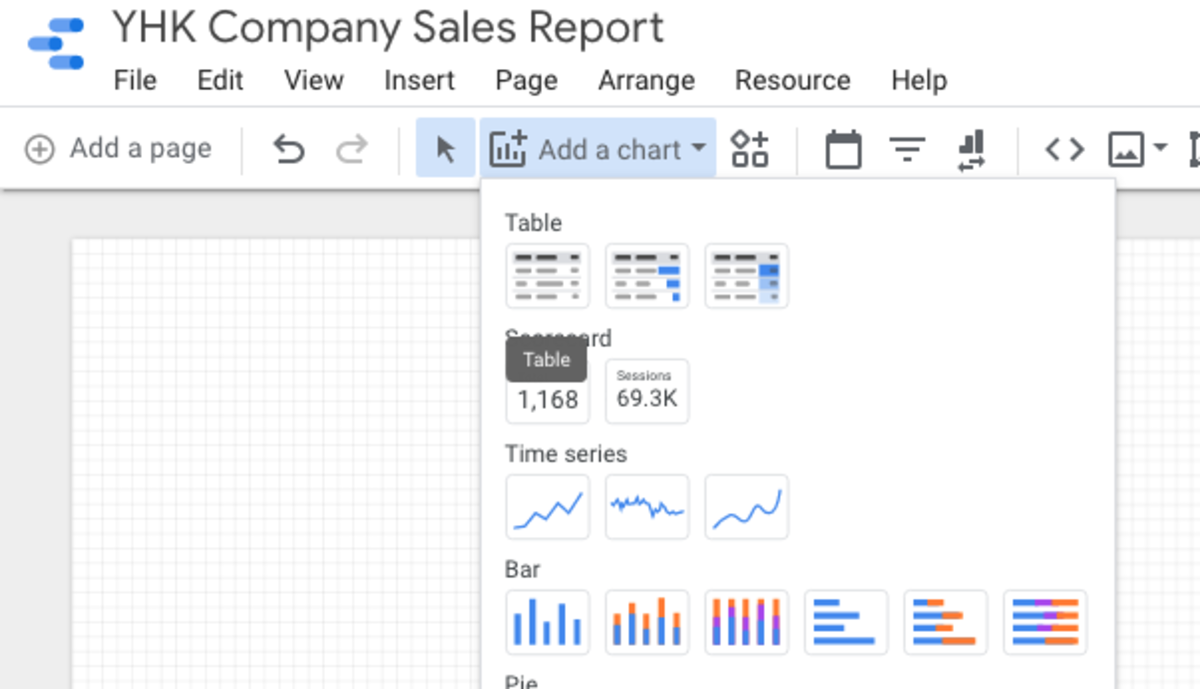
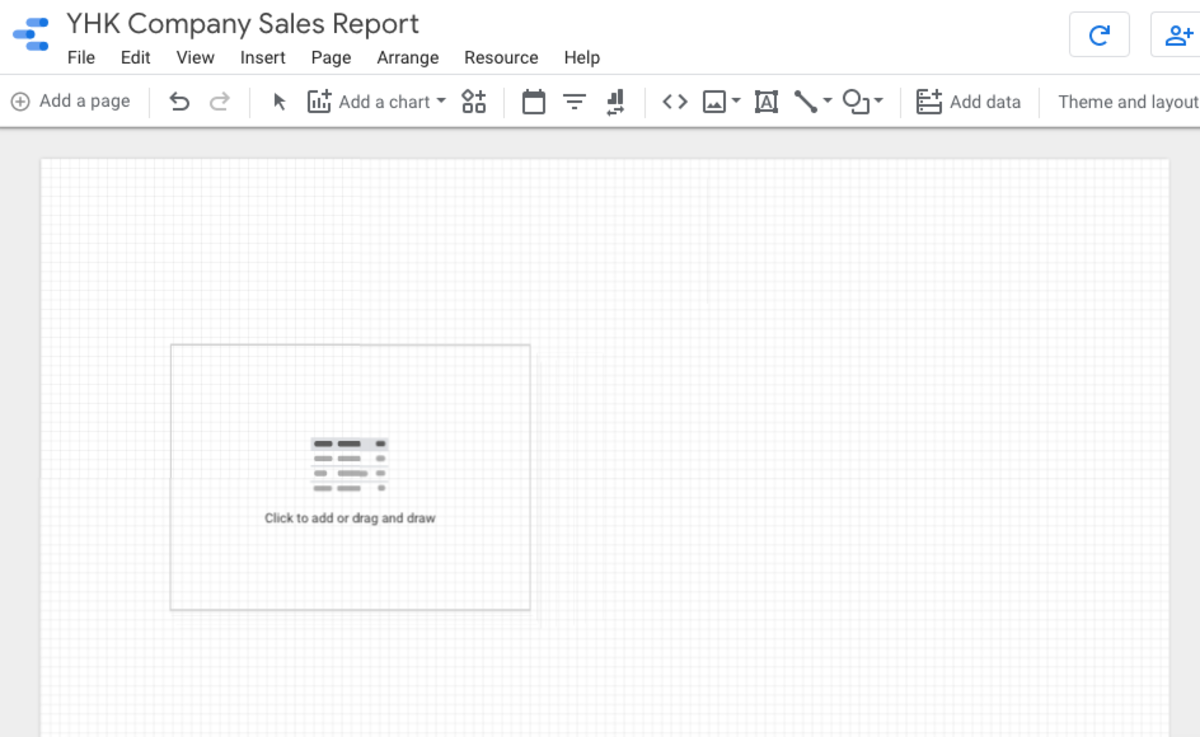
Google Data Studio makes it extremely easy for anyone, even without technical knowledge or prior experience in data visualisation, to create custom dashboards that pull from multiple data sources. We will not be using any of the templates or reuse reports built by the community. Instead we shall create a new Report from scratch. In this tutorial, we are going to build a simple Sales Report Google Data Studio dashboard. Give an appropriate name to your first Report and delete any charts that has been auto-added by Google Data Studio. Click on the “Add a Chart” button on the toolbar and then click on the Table icon.
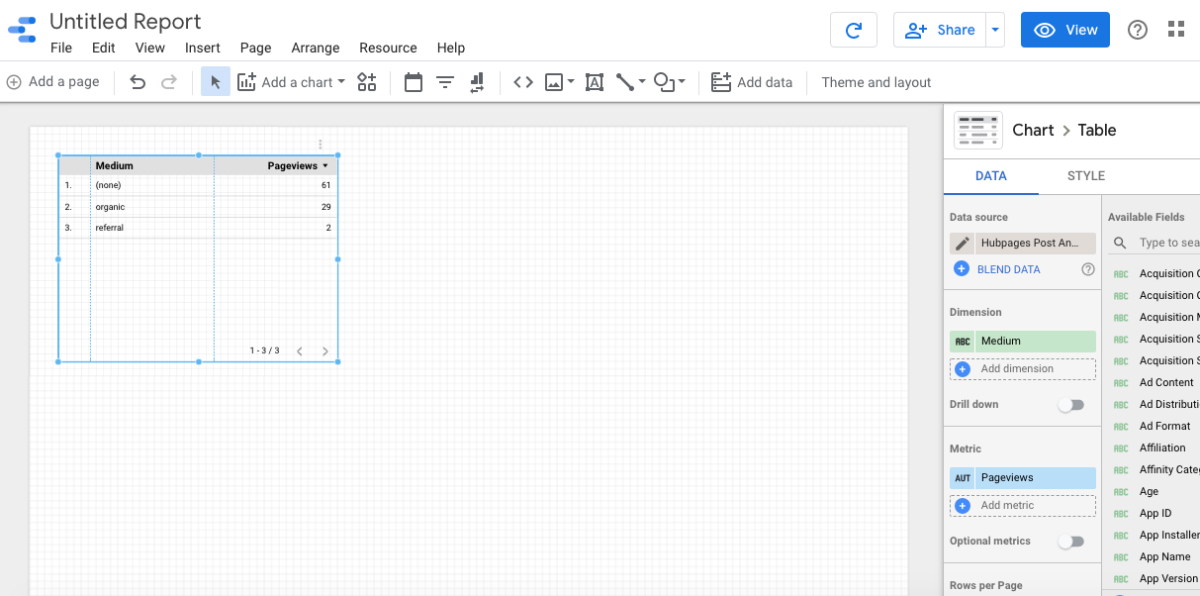
Adding Fields to the Report
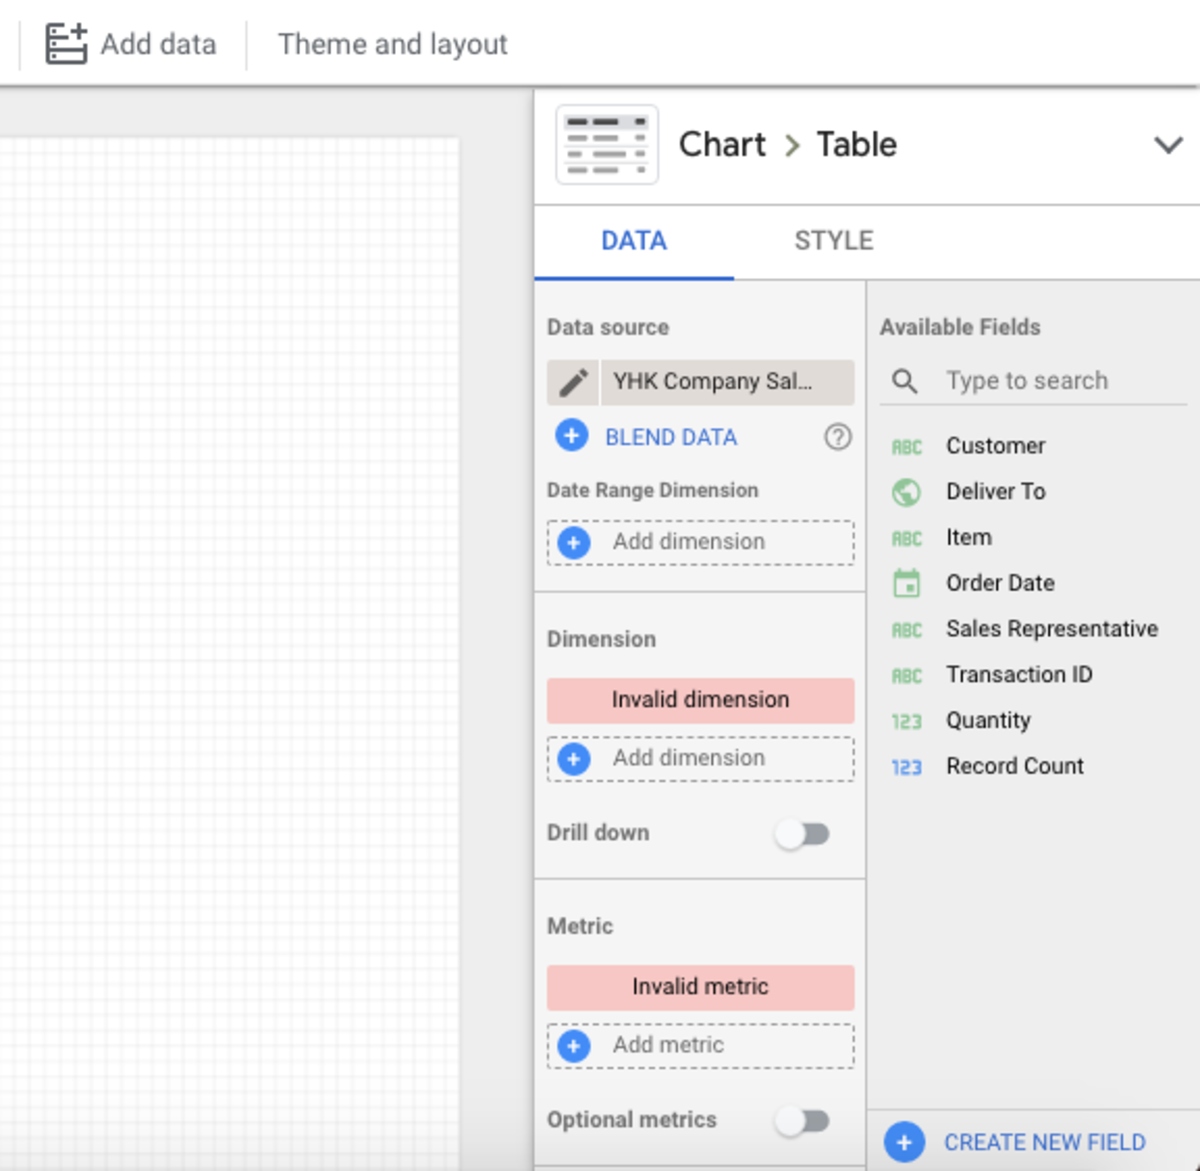
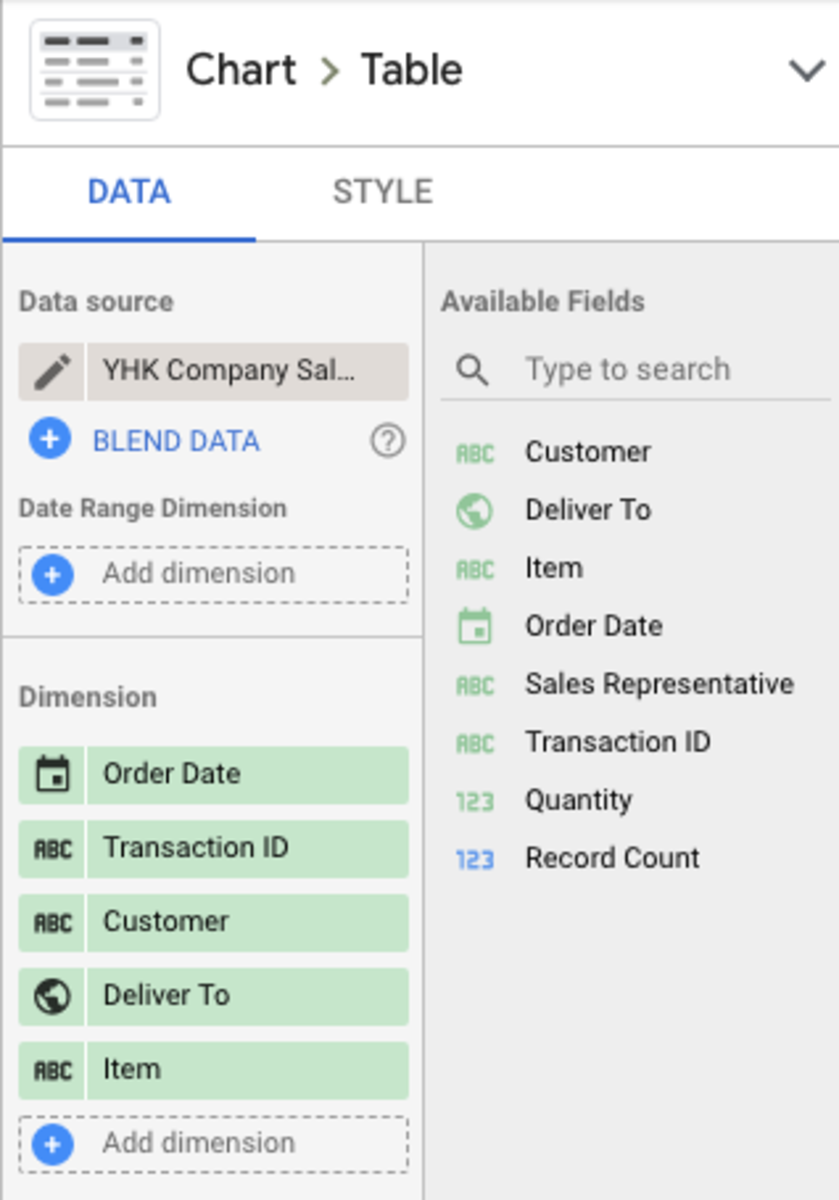
Look to the right, can you see all the fields which correspond to the YHK Company Sales Sample Data in Google Sheets? Click “Add Dimension” and start to add all fields in the following sequence. Drag the Table so that it occupies the entire width of the page.
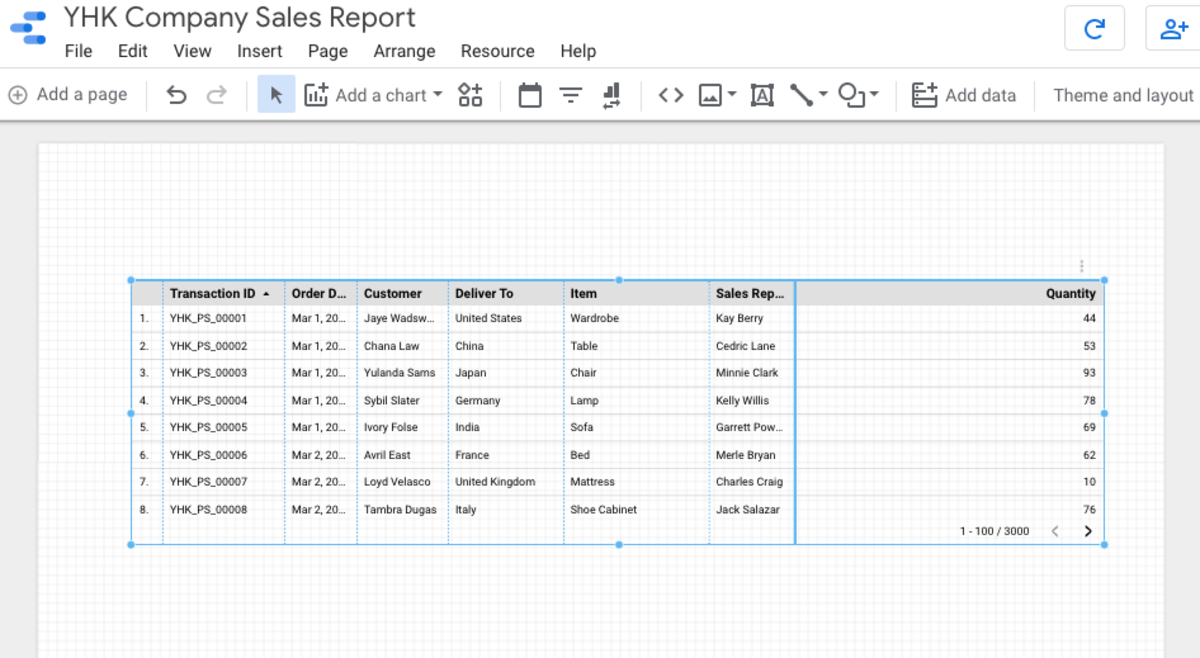
Click anywhere on the Canva to Add That Table
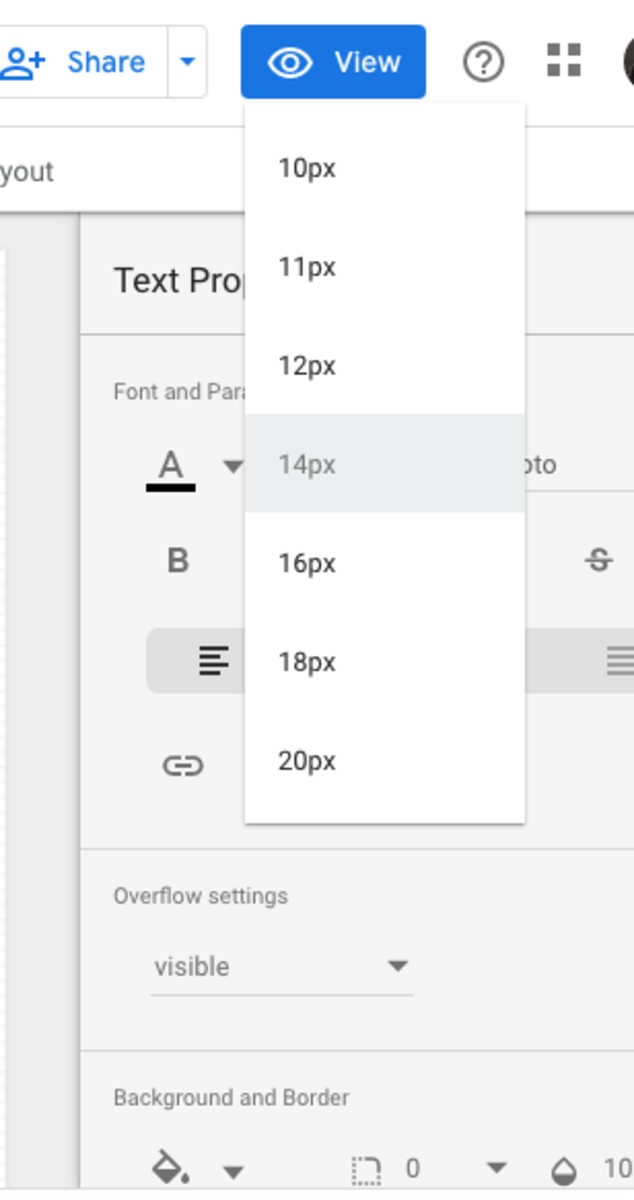
Next, we are just going to add a title to the Page to finish off your first Google Data Studio Report. From the right, choose the Font type and Size.
What’s Next
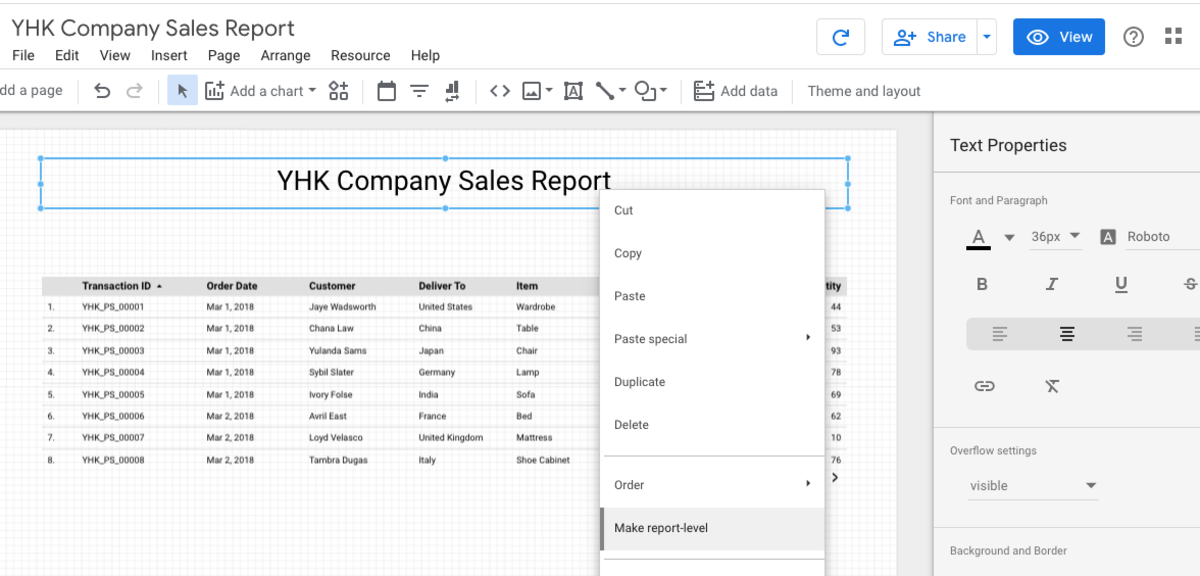
Click on the Title you have just entered, select Make Report Level so that it will appear on each page of your report. Congratulations, you have just created your first Google Data Studio Report. Google Data Studio unlocks the power of your data with interactive dashboards and beautiful reports. Up next, we will learn how to turn your Report interactive for richer reporting.
Navigation
Learn How to Use Google Data Studio to Visualise Data Easily Google Data Studio - Getting Started Data Connectors - Connect To Google Sheets Your First Visualisation Report using Google Data Studio Richer Interactive in Google Data Studio About Filter Control In Google Data Studio Using Charts as Interactive Filters in Google Data Studio Managing Data Sources in Google Data Studio © 2020 Heng Kiong Yap